Summary Methodology for Pre-Master CIS (all important theory exam!)
Extensive Summary Methodology for Premaster CIS (Important theory for exam!)
Todos para este libro de texto (13)
Escuela, estudio y materia
Radboud Universiteit Nijmegen (RU)
International Business Communication
Research Methodology
Todos documentos para esta materia (5)
Vendedor
Seguir
iphjanssen
Comentarios recibidos
Vista previa del contenido
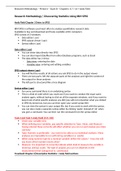
Research Methodology – Period 4 – Exam B – Chapters: 6 + Andy Field
Research Methodology Discovering Statistics Using IBM SPSS
Andy Field Chapter 3Intro to SPSS
IBM SPSS is software used most often to analyze quantitative research data
Available to buy and download and freely available at RU computers
SPSS consist of 3 windows:
Data editor (.sav)
SPSS output viewer (.spv)
Syntax editor (.sps)
Data editor (.sav)
You can enter data directly into SPSS
You can also import datafiles from other database programs, such as Excel
The data editor has 2 views:
- Data view: entering the date
- Variable view: entering and editing variables
SPSS output viewer (.spv)
You will find the results of all actions you ask SPSS to do in the output viewer
There are two parts: left the separate parts of the analyses and right the content of
the output for these analyses
The left part is structured like a tree diagram
Syntax editor (.sps)
For every command there is an underlying syntax
This is a kind of code which you could use if you want to conduct the exact same
analysis again, without having to click on all the separate windows, and if you want to
keep track of what specific analyses you did (you will not remember what you clicked
in SPSS by tomorrow, but you can then open your saved syntax file)
You can view the syntax in your output file, but if you want to work with the syntax,
you can also create a separate syntax editor by clicking ‘paste’ instead of ‘ok’ when
you give a command. You can then run the command from the syntax editor
Task 2 and Task 5 Andy Field (117-118)
Check your variable view
When defining your variables, pay specific attention to Type, Value, and Measure –
having entered these correctly will affect whether you can run and analyse your data
correctly
Type: Numeric is preferable – you want to be able to run statistical analyses. Many
analyses are impossible to run with string variables (i.e. words)
When using numeric type for a nominal variable: define the values! – how else will
you know which number means what?
Measure: it is important to correctly indicate which kind of measure the variable is
(nominal, ordinal, scale). The type of analysis you can run depends on the
measurement level (categorical vs. continuous)
Treadwell Chapter 6Descriptive Statistics + Andy field sections
, Research Methodology – Period 4 – Exam B – Chapters: 6 + Andy Field
Statistics
What can you do with statistics? Most interestingly:
See whether a manipulation that you as a researcher caused has an effect
See whether variables are correlated
i.e. Test your hypothesis, usually by comparing data from different groups
How to do this?
By looking at the variation in your participants’ data
The design of your study determines how you will analyse this variation
Very important: the difference between within-subject and between-subject design.
Two kinds of variation (in data):
Systematic variation: variation in the data due to a manipulation (in this kind of data,
you as a researcher are mostly interested in)
Unsystematic variation: variation resulting from random factors (so NOT from your
manipulation but e.g. individual characteristics of your participants)
When you run statistical analyses you basically determine how much of the total variation in
your data is systematic and how much of the total variation is unsystematic. It is preferable
to keep the unsystematic, or random, variation as low as possible, so that most of the
variation will be caused by your manipulation.
Within-subject measures:
Condition 1 Condition 2
Group 1 X X
Because the same person takes part in both conditions, the unsystematic variation will be
lower.
Between-subject measure:
Condition 1 Condition 2
Group 1 X
Group 2 X
Because a person takes part in only one of the conditions, the unsystematic variation will be
higher (people from group 1 will differ from people from group 2 in various ways, regardless
of your manipulation)
Ways to keep unsystematic variation low:
Using a within subject design (but not always possible/practical)
Random assignment of your participants to different conditions (n.b. this is not the
same as random sampling!)
Randomizing the order of conditions of your study
Main Idea: When you do statistical analyses you basically decide how much of the variation
in your data is systematic and how much is unsystematic.
This is done by computing a ratio of both types of variation:
Systematic variation (caused by the model/your manipulation) = Effect
Unsystematic variation (NOT caused by the model/your manipulation) Error
- This ratio is called a test statistic
Los beneficios de comprar resúmenes en Stuvia estan en línea:
Garantiza la calidad de los comentarios
Compradores de Stuvia evaluaron más de 700.000 resúmenes. Así estas seguro que compras los mejores documentos!
Compra fácil y rápido
Puedes pagar rápidamente y en una vez con iDeal, tarjeta de crédito o con tu crédito de Stuvia. Sin tener que hacerte miembro.
Enfócate en lo más importante
Tus compañeros escriben los resúmenes. Por eso tienes la seguridad que tienes un resumen actual y confiable.
Así llegas a la conclusión rapidamente!
Preguntas frecuentes
What do I get when I buy this document?
You get a PDF, available immediately after your purchase. The purchased document is accessible anytime, anywhere and indefinitely through your profile.
100% de satisfacción garantizada: ¿Cómo funciona?
Nuestra garantía de satisfacción le asegura que siempre encontrará un documento de estudio a tu medida. Tu rellenas un formulario y nuestro equipo de atención al cliente se encarga del resto.
Who am I buying this summary from?
Stuvia is a marketplace, so you are not buying this document from us, but from seller iphjanssen. Stuvia facilitates payment to the seller.
Will I be stuck with a subscription?
No, you only buy this summary for $5.16. You're not tied to anything after your purchase.