Summary Discovering Statistics Using IBM SPSS Statistics
Todos para este libro de texto (8)
Escuela, estudio y materia
Universiteit van Amsterdam (UvA)
Psychologie
Statistical Reasoning
Todos documentos para esta materia (1)
4
reseñas
Por: serifetutumlu1996 • 3 año hace
Por: tinnarssigurardttir • 3 año hace
Por: annesmit1 • 3 año hace
Por: dsdingelhoff • 3 año hace
Vendedor
Seguir
MarenLoliBeers
Comentarios recibidos
Vista previa del contenido
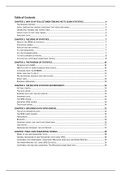
Table of Contents
CHAPTER 1: WHY IS MY EVIL LECTURER FORCING ME TO LEARN STATISTICS.....................................4
THE RESEARCH PROCESS...........................................................................................................................4
INITIAL OBSERVATION: FINDING SOMETHING THAT NEEDS EXPLAINING...............................................................4
GENERATING THEORIES AND TESTING THEM.................................................................................................4
COLLECT DATA TO TEST YOUR THEORY.........................................................................................................4
ANALYSING DATA....................................................................................................................................6
CHAPTER 2: THE SPINE OF STATISTICS...............................................................................................7
WHAT IS THE SPINE OF STATISTICS............................................................................................................7
STATISTICAL MODELS...............................................................................................................................7
POPULATIONS AND SAMPLES.....................................................................................................................7
P IS FOR PARAMETERS..............................................................................................................................7
S IS FOR STANDARD ERROR.......................................................................................................................7
I IS FOR (CONFIDENCE) INTERVAL................................................................................................................8
N IS FOR NULL HYPOTHESIS SIGNIFICANCE TESTING........................................................................................8
CHAPTER 3: THE PHOENIX OF STATISTICS........................................................................................10
PROBLEMS WITH NHST.........................................................................................................................10
NHST AS PART OF WIDER PROBLEMS WITH SCIENCE....................................................................................10
A PHOENIX FROM THE EMBERS..............................................................................................................11
SENSE, AND HOW TO USE IT....................................................................................................................11
PRE-REGISTERING RESEARCH AND OPEN SCIENCE.........................................................................................11
EFFECT SIZES........................................................................................................................................12
BAYESIAN APPROACHES..........................................................................................................................12
CHAPTER 4: THE IBM SPSS STATISTICS ENVIRONMENT....................................................................13
GETTING STARTED.................................................................................................................................13
THE DATA EDITOR.................................................................................................................................13
ENTERING DATA INTO THE DATA EDITOR....................................................................................................13
IMPORTING DATA..................................................................................................................................14
THE SPSS VIEWER................................................................................................................................14
EXPORTING SPSS VIEWER.......................................................................................................................14
THE SYNTAX EDITOR..............................................................................................................................14
CHAPTER 5: EXPLORING DATA WITH GRAPHS.................................................................................15
THE ART OF PRESENTING DATA................................................................................................................15
THE SPSS CHART BUILDER......................................................................................................................15
HISTOGRAMS.......................................................................................................................................15
BOXPLOTS...........................................................................................................................................16
GRAPHING MEANS: BAR CHARTS AND ERROR BARS......................................................................................16
LINE CHARTS........................................................................................................................................17
GRAPHING RELATIONSHIPS: THE SCATTERPLOT............................................................................................17
CHAPTER 7 FIELD: NON-PARAMETRIC MODELS...............................................................................18
WHEN TO USE NON-PARAMETRIC TESTS....................................................................................................18
GENERAL PROCEDURE OF NON-PARAMETRIC TESTS USING SPSS.....................................................................18
COMPARING TWO INDEPENDENT CONDITIONS: WILCOXON RANK-SUM AND MANN-WHITNEY.............................19
THE MANN-WHITNEY TEST USING SPSS STATISTICS....................................................................................19
COMPARING TWO RELATED CONDITIONS: THE WILCOXON SIGNED-RANK TEST..................................................19
, DOING THE WILCOXON SIGNED-RANK TEST USING SPSS STATISTICS...............................................................20
DIFFERENCES BETWEEN SEVERAL INDEPENDENT GROUPS: THE KRUSKAL-WALLIS TEST........................................20
DOING THE KRUSKAL-WALLIS TEST USING SPSS STATISTICS..........................................................................20
DIFFERENCES BETWEEN SEVERAL RELATED GROUPS: FRIEDMAN’S ANOVA.......................................................20
DOING FRIEDMAN’S ANOVA USING SPSS STATISTICS.................................................................................20
FIELD CHAPTER 8: CORRELATION.....................................................................................................21
STANDARDIZATION AND THE CORRELATION COEFFICIENT...............................................................................21
THE SIGNIFICANCE OF THE CORRELATION COEFFICIENT..................................................................................22
BIVARIATE CORRELATION........................................................................................................................22
GENERAL PROCEDURE FOR CORRELATIONS USING SPSS STATISTICS.................................................................22
DIFFERENT CORRELATION COEFFICIENTS IN SPSS.........................................................................................22
BISERIAL AND POINT-BISERIAL CORRELATIONS.............................................................................................23
PARTIAL CORRELATION...........................................................................................................................23
COMPARING INDEPENDENT AND DEPENDENT RS..........................................................................................23
CALCULATING THE EFFECT SIZE.................................................................................................................24
FIELD CHAPTER 9: THE LINEAR MODEL (REGRESSION).....................................................................25
AN INTRODUCTION TO THE LINEAR MODEL.................................................................................................25
ESTIMATING THE MODEL........................................................................................................................25
OUTLIERS............................................................................................................................................25
INFLUENTIAL CASES................................................................................................................................25
ASSUMPTIONS OF THE LINEAR MODEL.......................................................................................................26
CROSS-VALIDATION OF THE MODEL...........................................................................................................26
THE LINEAR MODEL WITH TWO OR MORE PREDICTORS (MULTIPLE REGRESSION)................................................26
MULTICOLLINEARITY..............................................................................................................................26
USING SPSS STATISTICS TO FIT A LINEAR MODEL WITH SEVERAL PREDICTORS....................................................27
INTERPRETING A LINEAR MODEL WITH SEVERAL PREDICTORS..........................................................................27
CHAPTER 10: COMPARING TWO MEANS.........................................................................................28
THE T-TEST..........................................................................................................................................28
COMPARING TWO INDEPENDENT MEANS USING SPSS STATISTICS...................................................................28
COMPARING TWO RELATED MEANS USING SPSS STATISTICS..........................................................................29
EFFECT SIZES FOR TWO INDEPENDENT MEANS.............................................................................................29
FIELD CHAPTER 11: MODERATION AND MEDIATION.......................................................................30
MODERATION: INTERACTIONS IN THE LINEAR MODEL...................................................................................30
CENTRING VARIABLES.............................................................................................................................30
MODERATION ANALYSIS USING IBM SPSS STATISTICS.................................................................................30
MEDIATION: THE CONCEPTUAL AND STATISTICAL MODEL..............................................................................30
EFFECT SIZES OF MEDIATION....................................................................................................................31
MEDIATION USING SPSS STATISTICS.........................................................................................................31
CHAPTER 12: GLM 1: COMPARING SEVERAL INDEPENDENT MEANS................................................32
USING A LINEAR MODEL TO COMPARE SEVERAL MEANS................................................................................32
LOGIC OF THE F-STATISTIC......................................................................................................................32
ASSUMPTIONS WHEN COMPARING MEANS.................................................................................................32
PLANNED CONTRASTS (CONTRAST CODING)................................................................................................32
POST HOC TESTS...................................................................................................................................33
COMPARING SEVERAL MEANS USING SPSS STATISTICS.................................................................................34
2
, OUTPUT FROM ONE-WAY INDEPENDENT ANOVA.......................................................................................34
CALCULATING EFFECT SIZE.......................................................................................................................34
CHAPTER 13: GLM 2: COMPARING MEANS ADJUSTED FOR OTHER PREDICTORS.............................35
WHAT IS ANCOVA?.............................................................................................................................35
ASSUMPTIONS AND ISSUES IN ANCOVA...................................................................................................35
CONDUCTING ANCOVA USING SPSS STATISTICS.......................................................................................35
INTERPRETING ANCOVA.......................................................................................................................36
TESTING THE ASSUMPTION OF HOMOGENEITY OF REGRESSION SLOPES.............................................................36
CALCULATING THE EFFECT SIZE.................................................................................................................36
CHAPTER 14: GLM 3: FACTORIAL DESIGNS.......................................................................................37
FACTORIAL DESIGNS...............................................................................................................................37
INDEPENDENT FACTORIAL DESIGNS AND THE LINEAR MODEL..........................................................................37
FACTORIAL DESIGNS USING SPSS STATISTICS..............................................................................................38
OUTPUT FROM FACTORIAL DESIGNS..........................................................................................................38
CALCULATING EFFECT SIZES.....................................................................................................................38
CHAPTER 15: GLM 4: REPEATED-MEASURES DESIGN.......................................................................39
THE ANOVA APPROACH TO REPEATED-MEASURES DESIGNS..........................................................................39
THE F-STATISTIC FOR REPEATED-MEASURES DESIGNS....................................................................................39
ONE-WAY REPEATED-MEASURES DESIGNS USING SPSS.................................................................................40
OUTPUT FOR ONE-WAY REPEATED-MEASURES DESIGNS................................................................................40
EFFECT SIZES FOR ONE-WAY REPEATED-MEASURES DESIGNS...........................................................................40
CHAPTER 16: GLM 5: MIXED DESIGNS..............................................................................................40
MIXED DESIGNS....................................................................................................................................40
MIXED DESIGNS USING SPSS STATISTICS...................................................................................................40
OUTPUT FOR MIXED FACTORIAL DESIGNS...................................................................................................41
CHAPTER 17: MULTIVARIATE ANALYSIS OF VARIANCE (MANOVA)..................................................41
INTRODUCING MANOVA......................................................................................................................41
INTRODUCING MATRICES........................................................................................................................41
THE THEORY BEHIND MANOVA..............................................................................................................42
PRACTICAL ISSUES WHEN CONDUCTING MANOVA.....................................................................................42
MANOVA USING SPSS STATISTICS.........................................................................................................43
INTERPRETING MANOVA......................................................................................................................43
CHAPTER 18: EXPLORATORY FACTOR ANALYSIS..............................................................................43
WHEN TO USE FACTOR ANALYSIS..............................................................................................................43
FACTORS AND COMPONENTS...................................................................................................................43
CHAPTER 19: CATEGORICAL OUTCOMES: CHI-SQUARE AND LOGLINEAR ANALYSIS.........................44
ANALYSING CATEGORICAL DATA...............................................................................................................44
TEST STATISTICS FOR ANALYSING CATEGORICAL DATA...................................................................................44
ASSUMPTIONS WHEN ANALYSING CATEGORICAL DATA..................................................................................45
DOING CHI-SQUARE USING SPSS STATISTICS..............................................................................................45
INTERPRETING THE CHI-SQUARE TEST........................................................................................................45
USING STANDARDIZED RESIDUALS.............................................................................................................46
3
, Chapter 1: Why is my evil lecturer forcing me to learn statistics
The research process
You begin with an observation that you want to understand. From your initial observation you
generate explanations, or theories, for those observations, from which you make predictions,
hypotheses. After this you collect some relevant data and then analyse those data. The analysis of
the data may support your theory or give you cause to modify the theory.
Initial observation: finding something that needs explaining
Having made a causal observation, you need to collect some data to see whether this observation is
true. To do this, you need to define one or more variables that you would like to measure and think
about how you will measure the variable.
Generating theories and testing them
The next logical step is trying to explain the data by coming up with a theory. From that theory you
can form predictions, known as a hypothesis. You can try to prove your hypothesis, but it is also
important to try and disprove a hypothesis or theory, known as falsification.
Collect data to test your theory
To test hypotheses, we need to measure variables, things that can change or vary, between people,
locations or even time.
- Variables: A variable we think is a cause is known as an independent variable (predictor),
because its value doesn’t depend on any other variables and predicts an outcome variable. A
variable that we think is an effect is called a dependent variable (outcome), because the
value of this variable depends on the cause, the independent variable, and changes as a
function of changes in a predictor variable. The relationship between what is being measured
and the numbers that represent what is being measured is known as the level of
measurement. There are two types of the level of measurement, categorical or continuous.
Categorical is divided into binary, nominal and ordinal variables, and continuous is divided
into interval and ratio variables. A categorical variable is made up of categories, for example
you’re a human or a cat or a fly, you can’t be a bit of a cat and a bit of human. A binary
variable is the simplest form of a categorical variable, it names just two distinct types of
things, male or female, yes or no. A nominal variable is used when numbers are used to
denote categories. An ordinal variable is used when categories are ordered. Ordinal data tell
us not only that things have occurred, but also the order in which they occurred. Another
level of measurement is continuous or interval variables. A continuous variable is one that
gives us a score for each person and can take on any value on the measurement scale that
we are using. The first type of continuous variable is an interval variable, here you must be
certain that equal intervals on the scale represent equal differences in the property being
measured. Ratio variables go a step further than interval data by requiring that in addition to
the measurement scale meeting the requirements of an interval variables, the ratios of
values along the scale should be meaningful, the scale must have a true and meaningful zero
point. Continuous variables can also be discrete. A discrete variable can take on only certain
values on the scale, usually whole numbers.
- Measurement error: There will often be a discrepancy between the numbers we use to
represent the thing we’re measuring and the actual value of the thing we’re measuring, this
discrepancy is known as measurement error.
- Validity and reliability: A way to try to ensure that measurement error is kept to a minimum
is to determine properties of the measure that gives us confidence that it is doing its job
properly. The first property is validity, which is whether an instrument actually measures
4
Los beneficios de comprar resúmenes en Stuvia estan en línea:
Garantiza la calidad de los comentarios
Compradores de Stuvia evaluaron más de 700.000 resúmenes. Así estas seguro que compras los mejores documentos!
Compra fácil y rápido
Puedes pagar rápidamente y en una vez con iDeal, tarjeta de crédito o con tu crédito de Stuvia. Sin tener que hacerte miembro.
Enfócate en lo más importante
Tus compañeros escriben los resúmenes. Por eso tienes la seguridad que tienes un resumen actual y confiable.
Así llegas a la conclusión rapidamente!
Preguntas frecuentes
What do I get when I buy this document?
You get a PDF, available immediately after your purchase. The purchased document is accessible anytime, anywhere and indefinitely through your profile.
100% de satisfacción garantizada: ¿Cómo funciona?
Nuestra garantía de satisfacción le asegura que siempre encontrará un documento de estudio a tu medida. Tu rellenas un formulario y nuestro equipo de atención al cliente se encarga del resto.
Who am I buying this summary from?
Stuvia is a marketplace, so you are not buying this document from us, but from seller MarenLoliBeers. Stuvia facilitates payment to the seller.
Will I be stuck with a subscription?
No, you only buy this summary for $9.44. You're not tied to anything after your purchase.