Blok 4.4 Applied Multivariate Data Analysis (FSWPEM040)
Institución
Erasmus Universiteit Rotterdam (EUR)
Book
Discovering Statistics Using IBM SPSS
Deze samenvatting is gebaseerd op de hoofdstukken 2, 3, 6, 8, 9, 11, 12, 13, 14, 15 en 16 (alle verplichte hoofdstukken) van de 5e editie van Field (2018). Daarnaast zijn ook aantekeningen van colleges en opdrachten verwerkt in de samenvatting, waardoor je in één bestand een volledige overzicht h...
Exam Guide for Applied Multivariate Data Analysis – Get yourself a Wonderful Grade!
Summary of Statistics (IBC), Radboud University
Answers assignment 3 business research methods
Todos para este libro de texto (117)
Escuela, estudio y materia
Erasmus Universiteit Rotterdam (EUR)
Master Onderwijswetenschappen
Blok 4.4 Applied Multivariate Data Analysis (FSWPEM040)
Todos documentos para esta materia (2)
2
reseñas
Por: veroniquebarbara7 • 1 año hace
Description mentions lecture notes and assignments are included but this just includes notes on the recommended reading chapters.
Por: fleurrekveld • 2 año hace
Vendedor
Seguir
Kayosa
Comentarios recibidos
Vista previa del contenido
Summary 4.4 Applied Multivariate Data Analysis
Field 5th edition (2018)
Article of Simmons, Nelson, & Simonsohn (2011)
False positives
Sample results that lead to rejecting the null hypothesis, while in fact
there is no effect in the population
Referred to as type I error
3 undesired consequences of false positives
In general Type I errors (false positives) are considered more undesirable
than Type II errors (false negatives)
The (real and ethical) costs of implementing a new treatment or changing
policy based on false effects are in general higher than (incorrectly)
accepting the current treatment or policy
1. Once they appear in the literature, false positives are particularly
persistent. Because null results have many possible causes, failures to
replicate previous findings are never conclusive.
2. False positives waste resources: They inspire investment in fruitless
research programs and can lead to ineffective policy changes
3. A field known for publishing false positives risks losing its credibility.
Researcher degrees of freedom
The flexibility of researchers in various aspects of data-collection, data-
analysis and reporting results
The false-positive rates exceed the fixed level of 5% by far in case of
flexibility in:
a) Choosing among dependent variables,
b) Choosing sample size
c) Using covariates
d) Reporting subsets of experimental conditions
Interim data analysis = testing in the meantime while including extra
respondents
Chapter 2 & 3: Hypotheses Testing, Estimation, Research Ethics
Statistical models
In statistics we fit models to our data: we use a statistical model to
represent what is happening in the real world
Models consist of parameters and variables
Variables are measured constructs (e.g. fatigue) and vary across people
in the sample
Parameters are estimated from the data and represent constant
relations between variables in the model
We compute the model parameters in the sample to estimate the value
in the population
1
, Greek notation refers to population (e.g. μ)
Samples
Interested in populations, but because we cannot collect data from
every human being in the population, we collect data from a small
subset of the population (known as a sample) and use these data to
infer things about the population as a whole
One sample will provide just an estimate of the true population
parameter
Depending on the variability AND sample size this estimate will be more
or less precise
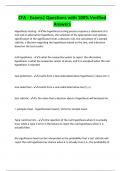
Number of subjects for a reliable model: 10 a 15 cases per
predictor
Power graph: the smaller the expected ‘effect’ (R 2) and the more
predictors in the model, the larger N must be for reliable estimates and
adequate power (.80)
Mean
A simple statistical model of the center of a distribution of scores
A hypothetical estimate of the ‘typical’ score
General principle of model fit: Sum (SSE) or Average (MSE) the squared
deviations from the model,
- Larger values indicating lack of fit
When the model is the mean, the MSE is called variance
The square root of the variance (s2) is called the standard deviation (s)
Intuitively more appealing interpretation: average deviation from the
mean, not in squared units
Use the variance, or standard deviation, to tell us how accurately the
mean represents our data
The standard deviation is a measure of how much error there is
associated with the mean: the smaller the standard deviation, the more
accurately the mean represents the data
Parameter b can be estimated by: b = mean
Model fit
The mean is a model of what happens in the real world: the typical
score
It is not a perfect representation of the data
Perfect fit vs. non-perfect fit: error
Calculating the error
The mean is the value from which the (squared) scores deviate least (it
has the least error)
Measures that summarize how well the mean represents the sample
data: sum of squared errors, mean squared error/variance, standard
deviation
Difference between standard deviation and standard error
2
, The standard deviation tells us how much observations in our sample
differ from the mean value within our sample
The standard error tells us not about how the sample mean represents
the sample itself, but how well the sample mean represents the
population mean
The standard error is the standard deviation of the sampling
distribution of a statistic
For a given statistic (e.g. the mean) it tells us how much variability
there is in this statistic across samples from the same population
Large (statistical) values indicate that a statistic from a given sample
may not be an accurate reflection of the population from which the
sample came
Standard error of the mean
Central limit theorem for sample of at least size 30, the sampling
distribution of sample means is a normal distribution with mean μ and
standard deviation
- Regardless of the shape of the population, parameter estimates of
that population will have a normal distribution provided the samples
are ‘big enough’
estimated from the sample
Where s is the sample standard deviation
Note: the larger N the smaller SE the more the sample mean is
representative of the population mean (the more precise our estimate
is)
The variance is the sum of squared errors divided by the degrees of
freedom
The standard deviation is square root of the variance
The mean squared error
Total dispersion depends on sample size, more informative to
compute the average dispersion: the mean of the squared errors (MSE)
We ‘average’ by dividing by the degrees of freedom (N-1) because we
use sample data to estimate the model fit in the population
We ‘loose’ one degree of freedom because we estimate the population
mean with the sample mean
Standard error and confidence intervals
95% CI: for 95% of all possible samples the population mean will be
within its limits
95% CI calculated by assuming the t-distribution as representative of
the sampling distribution
T-distribution looks like standard normal distribution, but fatter tails
depending on the df (here df = N-1)
tn-1 x SE is called the margin of error
3
, Test statistic
A statistic for which we know how frequently different values occur
The observed value of such a statistic is typically used to test
hypotheses, or to establish whether a model is a reasonable
representation of what’s happening in the population
Degrees of freedom for the t-test for a regression coefficient are n – p – 1
(p = number of independent variables in the model) always in
regression!
Null-hypothesis significance testing: NHST
Null hypothesis, H0
- There is no effect
- Notation: H0: μ = 0
The alternative hypothesis, H1
- Aka the experimental hypothesis
- Notation: H0: μ ≠ 0
Different types of hypothesis require different test statistics:
- Hypotheses concerning one or two means are tested with the t-test,
- Hypothesis concerning several means are tested with the F-test
Critical values of the t-distribution (table)
Caution interpretation NHST:
1. Significant effect, does not mean important effect
2. Type I and Type II errors
i. Non-significant effect does not mean H0 is true
ii. Simplistic all-or-nothing thinking
3. P-values can vary greatly from sample to sample
Confidence Intervals and NHST
When our H0 concerns one population mean, (e.g. H0: μ = 0),
- NHST = one-sample t-test
- Any value outside the 95% CI has p < .05, any value inside the 95%
has p > .05
When our H0 concerns the difference between two independent
population mean, (e.g. H0: μ1 – μ2 = 0),
- NHST = independent-samples t-test
- The amount of overlap of the 95% Cis of the two sample means,
helps us infer the p-value of the independent samples t-test
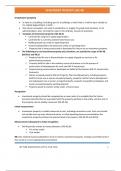
Type I and type II errors
A Type I error occurs when we believe
that there is a genuine effect in our
population, when in fact there isn’t (H 0 is
true)
A Type II error occurs when we believe
that there is no effect in the population
when, in reality, there is (Ha is true)
4
Los beneficios de comprar resúmenes en Stuvia estan en línea:
Garantiza la calidad de los comentarios
Compradores de Stuvia evaluaron más de 700.000 resúmenes. Así estas seguro que compras los mejores documentos!
Compra fácil y rápido
Puedes pagar rápidamente y en una vez con iDeal, tarjeta de crédito o con tu crédito de Stuvia. Sin tener que hacerte miembro.
Enfócate en lo más importante
Tus compañeros escriben los resúmenes. Por eso tienes la seguridad que tienes un resumen actual y confiable.
Así llegas a la conclusión rapidamente!
Preguntas frecuentes
What do I get when I buy this document?
You get a PDF, available immediately after your purchase. The purchased document is accessible anytime, anywhere and indefinitely through your profile.
100% de satisfacción garantizada: ¿Cómo funciona?
Nuestra garantía de satisfacción le asegura que siempre encontrará un documento de estudio a tu medida. Tu rellenas un formulario y nuestro equipo de atención al cliente se encarga del resto.
Who am I buying this summary from?
Stuvia is a marketplace, so you are not buying this document from us, but from seller Kayosa. Stuvia facilitates payment to the seller.
Will I be stuck with a subscription?
No, you only buy this summary for $7.78. You're not tied to anything after your purchase.