University Of Maryland - Baltimore
Las últimas cargas en University Of Maryland - Baltimore. ¿Buscando notas en University Of Maryland - Baltimore? Tenemos muchas notas, guias de estudio y notas de estudio disponsible para tu escuela.
-
352
- 0
-
29
All courses for University Of Maryland - Baltimore
-
ACCT 221 2
-
ACCT 221. 2
-
ALGEBRA 107 1
-
ANITA DOUGLAS PNEUMONIA SHADOW HEALTH CASE Experience overview ANITA DOUGLAS PNEUMONIA SHADOW HEALTH CASE Experience overview 1
-
BIO 101 12
-
BIO 103 2
-
BIO FINAL 1
-
BIOL 101 5
-
BIOL 211 1
-
BIOL101 1
-
Biomedical and Environmental Health Sciences BEHS364 1
-
BMGT 326 BMGT 326 1
-
CCA 610 9040 3
-
COMM382-AFRICAN COMMUNICATION SYSTEMS COMM382 1
-
CON 216 1
-
ECON 401 1
-
Elementary statistics 1
-
ENMG 652 1
-
ENVIRONMENTAL COMMUNICATION JOUR458P 1
-
FINC 306 FINC 306 (FINC 306 Sophia __ Microeconomics Unit 3 Milestone 3) 3
-
FINC 306 ) FINC 306 1
-
Focused Exam COPD Results Prescription Writing Score Focused Exam COPD Results Prescription Writing Score 1
-
HRMD 650 Essay Organizational Development and Change - HRMD 650 > Case Study 2 - Ben and Jerry’s (complete latest solution) Score: 90 / 100 - 90 % 2
-
HUMAN RESOURCE MANAGEMENT - HRMD 650 HRMD 650 2
-
HUMAN RESOURCE MANAGEMENT; HRMD 650 HRMD 650 1
-
IFSM 201 other 15
-
IFSM 201 WEEK 1 IFSM 201 WEEK 1 1
-
IFSM 201 WEEK 4 IFSM 201 WEEK 4 1
-
IFSM 300 1
-
IFSM 300 - System Recommendation Chesapeake IT Stage 4 IFSM 300 1
-
IFSM 300 Final Exam. 1
-
IFSM 461 1
-
IFSM300 IFSM300 1
-
Information Technology for Management: Digital Strategies for Insight, Action, and Sustainable Performance 1
-
JOUR200 - KEY COMMUNICATION THEORIES 1
-
MC 306 2
-
MD 2000 1
-
Military Studies SEJPME 2
-
NURS 362 Comprehensive Assessment Completed Shadow Health 2
-
NURS 462 1
-
NURS 511 1
-
NURSING 350 NURSING350 3
-
NURSING 362 1
-
NUTR 100 NUTR 100 17
-
NUTR 100 Final Exam With Essay 1
-
NUTR 100 Week 8 Final Exam _ 100% CORRECT ANSWERS 1
-
NUTR 100 Week 8 Final Exam Nutrition Questions And Answers NUTR 100 4
-
NUTR 100 Week 8 Final Exam- Questions and Answers 3
-
NUTR 100 Week 8 Final Exam-Nutrient 1
-
NUTR 100 Week 8 Final Exam-Questions and Answers 2
-
NUTR100 2
-
NUTRI 100 NUTRI 100 Week 1 9
-
NUTRI 100 QUIZ 7 Nutrition & Society; Achieving Optimal Health NUTR100 2
-
Nutrition NUTR 100 1
-
NUTRITION 100 FINAL EXAM 1
-
NUTRITION 100 FINAL EXAM STUDY 1
-
Philosophy 140 phil140 1
-
PSY 301 1
-
PSYC 300 PSYC300 4
-
Quiz Submissions - Week 1: Quiz 1 - STAT 200 6372 Introduction to Statistics / STAT 200 week 1 quiz 1 STATISTICS200 2
-
Shadow health peds asthma peds shadow health peds asthma peds 5580 1
-
SOC 101 1
-
SOCIOLOGY 100 11
-
Sophia STATS200 1
-
Sophia Intro to Stats Unit 2 Milestone 2 1
-
Sophia Intro to Stats Unit 2 Milestone 3 Sophia Intro to Stats Unit 2 Milestone 2 1
-
Sophia __ Intro to Stats Unit 5 Milestone 5 STAT 200 1
-
Sophia __ Microeconomics Final Milestone FINC 306 1
-
Sophia __ Microeconomics Unit 3 Milestone 3 FINC 306 1
-
Sophia __ Microeconomics Unit 4 Milestone 4. 1
-
STAT 200 STAT200 42
-
STAT 200 ALL QUIZZES BUNDLED TOGETHER VERIFIED A+ STAT 200 ALL QUIZZES BUNDLED TOGETHER 1
-
Stat 200 Midterm Exam Verified A+ Latest Update Stat 200 Midterm Exam 1
-
Stat 200 Quiz 1 STAT200 1
-
STAT 200 Week 6 Homework Problems STAT200 2
-
STAT 200 Week 7 Homework Problems 2
-
STAT200 9
-
STATISTICS 200 STATISTICS200 2
-
STATISTICS 200-6367 1
-
STATISTICS STAT 200 1
Últimos notas y resúmenes University Of Maryland - Baltimore
1.) A doctor wishes to estimate the mean triglyceride level of patients two hours after eating a steak dinner. To estimate the mean, you collect data from 22 patients. State the individual, variable, population, sample, parameter, and statistic. Individual: The triglyceride level of patients two hours after eating a steak dinner. Population: Total number of patients. Sample: The 22 patients. Parameter: Population mean. Statistic: Sample mean. 2.) Explain why the relative frequency column...
- Package deal
- Otro
- • 6 páginas's •
-
University Of Maryland - Baltimore•STAT 200
-
STAT 200 WEEK 1,2,3,4,5,6,7,8, MIDTERM EXAM & FINAL EXAM SOLUTIONS. {GRADED A}• PorMichael01
Vista previa 2 fuera de 6 páginas
1.) A doctor wishes to estimate the mean triglyceride level of patients two hours after eating a steak dinner. To estimate the mean, you collect data from 22 patients. State the individual, variable, population, sample, parameter, and statistic. Individual: The triglyceride level of patients two hours after eating a steak dinner. Population: Total number of patients. Sample: The 22 patients. Parameter: Population mean. Statistic: Sample mean. 2.) Explain why the relative frequency column...
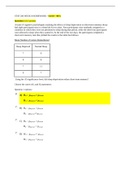
Question 1 (0.5 points) A team of cognitive psychologists studying the effects of sleep deprivation on short-term memory decay had eight participants stay in a sleep lab for two days. Four participants were randomly assigned to a condition in which they were not permitted to sleep during that period, while the other four participants were allowed to sleep when they wanted to. At the end of the two days, the participants completed a short-term memory task that yielded the results in the tabl...
- Package deal
- Examen
- • 14 páginas's •
-
University Of Maryland - Baltimore•STAT 200
-
STAT 200 WEEK 1,2,3,4,5,6,7,8, MIDTERM EXAM & FINAL EXAM SOLUTIONS. {GRADED A}• PorMichael01
Vista previa 2 fuera de 14 páginas
Question 1 (0.5 points) A team of cognitive psychologists studying the effects of sleep deprivation on short-term memory decay had eight participants stay in a sleep lab for two days. Four participants were randomly assigned to a condition in which they were not permitted to sleep during that period, while the other four participants were allowed to sleep when they wanted to. At the end of the two days, the participants completed a short-term memory task that yielded the results in the tabl...
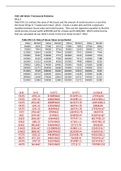
Table #10.1.6 contains the value of the house and the amount of rental income in a year that the house brings in (“Capital and rental,” 2013). Create a scatter plot and find a regression equation between house value and rental income. Then use the regression equation to find the rental income a house worth $230,000 and for a house worth $400,000. Which rental income that you calculated do you think is closer to the true rental income? Why? Table #10.1.6: Data of House Value versus Renta...
- Package deal
- Examen
- • 14 páginas's •
-
University Of Maryland - Baltimore•STAT 200
-
STAT 200 WEEK 1,2,3,4,5,6,7,8, MIDTERM EXAM & FINAL EXAM SOLUTIONS. {GRADED A}• PorMichael01
Vista previa 2 fuera de 14 páginas
Table #10.1.6 contains the value of the house and the amount of rental income in a year that the house brings in (“Capital and rental,” 2013). Create a scatter plot and find a regression equation between house value and rental income. Then use the regression equation to find the rental income a house worth $230,000 and for a house worth $400,000. Which rental income that you calculated do you think is closer to the true rental income? Why? Table #10.1.6: Data of House Value versus Renta...

1. You choose an alpha level of .01 and then analyze your data. a. What is the probability that you will make a Type I error given that the null hypothesis is true? 1% b. What is the probability that you will make a Type I error given that the null hypothesis is false? 0% 2. True/false: It is easier to reject the null hypothesis if the researcher uses a smaller alpha (α) level. 3. Below are data showing the results of six subjects on a memory test. The three scores per subject are the...
- Package deal
- Examen
- • 7 páginas's •
-
University Of Maryland - Baltimore•STAT 200 Week 6 Homework Problems
-
STAT 200 WEEK 1,2,3,4,5,6,7,8, MIDTERM EXAM & FINAL EXAM SOLUTIONS. {GRADED A}• PorMichael01
Vista previa 2 fuera de 7 páginas
1. You choose an alpha level of .01 and then analyze your data. a. What is the probability that you will make a Type I error given that the null hypothesis is true? 1% b. What is the probability that you will make a Type I error given that the null hypothesis is false? 0% 2. True/false: It is easier to reject the null hypothesis if the researcher uses a smaller alpha (α) level. 3. Below are data showing the results of six subjects on a memory test. The three scores per subject are the...
1. Why is a 99% confidence interval wider than a 95% confidence interval? 99% confidence interval is only slightly wider. In order to have a higher degree of confidence you need to include a larger proportion of the population. 2. A person claims to be able to predict the outcome of flipping a coin. This person is correct 16/25 times. Compute the 95% confidence interval on the proportion of times this person can predict coin flips correctly. What conclusion can you draw about this test of...
- Package deal
- Examen
- • 5 páginas's •
-
University Of Maryland - Baltimore•STAT 200
-
STAT 200 WEEK 1,2,3,4,5,6,7,8, MIDTERM EXAM & FINAL EXAM SOLUTIONS. {GRADED A}• PorMichael01
Vista previa 2 fuera de 5 páginas
1. Why is a 99% confidence interval wider than a 95% confidence interval? 99% confidence interval is only slightly wider. In order to have a higher degree of confidence you need to include a larger proportion of the population. 2. A person claims to be able to predict the outcome of flipping a coin. This person is correct 16/25 times. Compute the 95% confidence interval on the proportion of times this person can predict coin flips correctly. What conclusion can you draw about this test of...
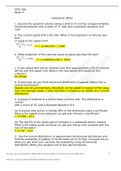
1. Assume the speed of vehicles along a stretch of I-10 has an approximately normal distribution with a mean of 71 mph and a standard deviation of 8 mph. a. The current speed limit is 65 mph. What is the proportion of vehicles less than or equal to the speed limit? 65−71 8 =−0.75 P = 22.66x100 = .2266 b. What proportion of the vehicles would be going less than 50 mph? 50−71 8 =−2.625 P = 0.x100 = .0043 c. A new speed limit will be initiated such that approximately 10% of veh...
- Package deal
- Examen
- • 4 páginas's •
-
University Of Maryland - Baltimore•STAT 200
-
STAT 200 WEEK 1,2,3,4,5,6,7,8, MIDTERM EXAM & FINAL EXAM SOLUTIONS. {GRADED A}• PorMichael01
Vista previa 1 fuera de 4 páginas
1. Assume the speed of vehicles along a stretch of I-10 has an approximately normal distribution with a mean of 71 mph and a standard deviation of 8 mph. a. The current speed limit is 65 mph. What is the proportion of vehicles less than or equal to the speed limit? 65−71 8 =−0.75 P = 22.66x100 = .2266 b. What proportion of the vehicles would be going less than 50 mph? 50−71 8 =−2.625 P = 0.x100 = .0043 c. A new speed limit will be initiated such that approximately 10% of veh...
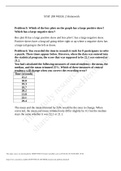
Problem 9: Which of the box plots on the graph has a large positive skew? Which has a large negative skew? Box plot B has a large positive skew and box plot C has a large negative skew. Positive skews have a long tail going either right or up where a negative skew has a large tail going to the left or down. Problem 6: You recorded the time in seconds it took for 8 participants to solve a puzzle. These times appear below. However, when the data was entered into the statistical program, the...
- Package deal
- Examen
- • 4 páginas's •
-
University Of Maryland - Baltimore•STAT 200
-
STAT 200 WEEK 1,2,3,4,5,6,7,8, MIDTERM EXAM & FINAL EXAM SOLUTIONS. {GRADED A}• PorMichael01
Vista previa 1 fuera de 4 páginas
Problem 9: Which of the box plots on the graph has a large positive skew? Which has a large negative skew? Box plot B has a large positive skew and box plot C has a large negative skew. Positive skews have a long tail going either right or up where a negative skew has a large tail going to the left or down. Problem 6: You recorded the time in seconds it took for 8 participants to solve a puzzle. These times appear below. However, when the data was entered into the statistical program, the...
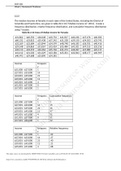
2.2.2 The median incomes of females in each state of the United States, including the District of Columbia and Puerto Rico, are given in table #2.2.10 ("Median income of," 2013). Create a frequency distribution, relative frequency distribution, and cumulative frequency distribution using 7 classes. Table #2.2.10: Data of Median Income for Females $31,862 $40,550 $36,048 $30,752 $41,817 $40,236 $47,476 $40,500 $60,332 $33,823 $35,438 $37,242 $31,238 $39,150 $34,023 $33,745 $33,269 $32,6...
- Package deal
- Examen
- • 8 páginas's •
-
University Of Maryland - Baltimore•STAT 200
-
STAT 200 WEEK 1,2,3,4,5,6,7,8, MIDTERM EXAM & FINAL EXAM SOLUTIONS. {GRADED A}• PorMichael01
Vista previa 2 fuera de 8 páginas
2.2.2 The median incomes of females in each state of the United States, including the District of Columbia and Puerto Rico, are given in table #2.2.10 ("Median income of," 2013). Create a frequency distribution, relative frequency distribution, and cumulative frequency distribution using 7 classes. Table #2.2.10: Data of Median Income for Females $31,862 $40,550 $36,048 $30,752 $41,817 $40,236 $47,476 $40,500 $60,332 $33,823 $35,438 $37,242 $31,238 $39,150 $34,023 $33,745 $33,269 $32,6...

1/31/2021 : Quiz Submissions - Week 1: Quiz 1 - STAT 200 6372 Introduction to Statistics (2202) - UMGC Learning Management System 1/8 Quiz Submissions - Week 1: Quiz 1 Tia Mercer (username: TMERCER5) Attempt 1 Submission View Your quiz has been submitted successfully. Question 1 3 / 3 points Statistics is the study of how to _____________________ data collected from a group. collect organize analyze interpret all of the above View Feedback Question 2 3 / 3 points Which of the four levels of meas...
- Examen
- • 8 páginas's •
-
University Of Maryland - Baltimore•Quiz Submissions - Week 1: Quiz 1 - STAT 200 6372 Introduction to Statistics / STAT 200 week 1 quiz 1
Vista previa 2 fuera de 8 páginas
1/31/2021 : Quiz Submissions - Week 1: Quiz 1 - STAT 200 6372 Introduction to Statistics (2202) - UMGC Learning Management System 1/8 Quiz Submissions - Week 1: Quiz 1 Tia Mercer (username: TMERCER5) Attempt 1 Submission View Your quiz has been submitted successfully. Question 1 3 / 3 points Statistics is the study of how to _____________________ data collected from a group. collect organize analyze interpret all of the above View Feedback Question 2 3 / 3 points Which of the four levels of meas...
1/31/2021 : Quiz Submissions - Week 1: Quiz 1 - STAT 200 6372 Introduction to Statistics (2202) - UMGC Learning Management System 1/8 Quiz Submissions - Week 1: Quiz 1 Tia Mercer (username: TMERCER5) Attempt 1 Submission View Your quiz has been submitted successfully. Question 1 3 / 3 points Statistics is the study of how to _____________________ data collected from a group. collect organize analyze interpret all of the above View Feedback Question 2 3 / 3 points Which of the four levels of meas...
- Examen
- • 8 páginas's •
-
University Of Maryland - Baltimore•Quiz Submissions - Week 1: Quiz 1 - STAT 200 6372 Introduction to Statistics / STAT 200 week 1 quiz 1
Vista previa 2 fuera de 8 páginas
1/31/2021 : Quiz Submissions - Week 1: Quiz 1 - STAT 200 6372 Introduction to Statistics (2202) - UMGC Learning Management System 1/8 Quiz Submissions - Week 1: Quiz 1 Tia Mercer (username: TMERCER5) Attempt 1 Submission View Your quiz has been submitted successfully. Question 1 3 / 3 points Statistics is the study of how to _____________________ data collected from a group. collect organize analyze interpret all of the above View Feedback Question 2 3 / 3 points Which of the four levels of meas...
