MATH211 (MATH211)
Shoreline Community College
All 2 resultados
Ordenador por
-
Assignments
- Otro • 3 páginas • 2023
- $5.49
- + aprende más y mejor
Assignments categories by the subjects listed. Mostly are lab work, while others are questions and answers. There are also essays included, but it's not in-depth.
-
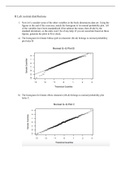
R Lab: normal distributions 1. As you can see, normal probability plots can be used both to assess normality and visualize skewness. Make a normal probability plot for female knee diameter (kne.di). Based on this normal probability plot, is this variable
- Otro • 2 páginas • 2023
- $3.49
- + aprende más y mejor
1. Now let’s consider some of the other variables in the body dimensions data set. Using the figures at the end of the exercises, match the histogram to its normal probability plot. All of the variables have been standardized (first subtract the mean, then divide by the standard deviation), so the units won’t be of any help. If you are uncertain based on these figures, generate the plots in R to check. 2. Note that normal probability plots C and D have a slight stepwise pattern. Why do you...

¿Quiere recuperar sus gastos?

