City of Hamilton
City Hall, 71 Main Street West
Hamilton, Ontario,
Canada L8P 4Y5
BRIEFING NOTE
Sanitary and Stormwater Network Infrastructure Plan
TO: City of Hamilton City Council & Committee
PREPARED BY: University of Toronto CIV1288 Consulting Team - Group 3
DATE: July 22, 2022
ISSUE/BACKGROUND
The City of Hamilton currently has a sanitary, storm and combined sewer network (referred to
of 1,100 km, consisting of over 17,300 pipes constructed from 1900 to 2013.
The average sewer pipe is 66 years old, with more than 61% of the pipes operating for more
than 50 years. The average diameter is 555 mm.
Sewer pipes are inspected via CCTV inspections and are assigned a score from 1 (best) to 5
(worst).
The sewer pipes are made of:
o Vitrified clay (VC) 31%
o Concrete (CON) 50%
o Polyvinyl Chloride (PVC) 4%
o Cured in place pipe (CIPP) 12%
o Other (e.g., brick, steel) 3%
Sewer pipes have a typical useful life of 100 years. However, many pipes have already exceeded
useful life:
o Wastewater 12%
o Storm 6%
Without continued maintenance and necessary rehabilitation, the deterioration within the
sewer pipes would lead to issues including but not limited to:
o Sewer blockage/backups -> Public Health and Safety / Odor / Mold
o Surface Overflow -> Public Health / Flooding / Property Damage / Traffic Congestion
o Drinking Water contamination -> Public Health Impact
o Untreated Sanitary/Storm -> Environmental Impacts
ii
,RECOMMENDATION
To stay within the 10-year budget forecast 2021 Recommended Water, Wastewater and
Stormwater Budget Plan (FCS20073) (City Wide) ), the rehabilitation policies below are
recommended to ensure optimal pipe conditions while staying within the forecasted budget
Due to the natural deterioration and characteristics of the different pipe materials,
rehabilitation policies are provided for each pipe material. Only pipes in conditions 3 (fair), 4
(poor) and 5 (immediate attention) are considered for rehabilitation policy.
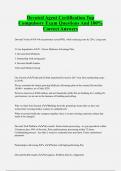
Recommended 10-Year Rehabilitation Policy
Pipe Policy (% of pipes to be Avg. Rehab Total Cost* Budget
Type rehabilitated) Condition Cost Forecast
3 4 5 Score
VC 0 0.02% 7.1% 2.35 $61,812 $65,522 $75,363
PVC 1.46% 1.57% 7.51% 1.62 $11,119 $11,832 $14,488
CON 0 2.72% 9.11% 1.82 $145,980 $153,903 $187,202
CIPP 0 5.93% 1.08% 2.32 $9,427 $9,965 $10,937
Total $228,338 $241,222 $287,990
*Total cost includes rehabilitation and maintenance
The Asset Management team is to identify further and prioritize pipes based on their criticality
when developing detailed plans.
Alternative rehabilitation policies and scenarios are available and can be found in the report.
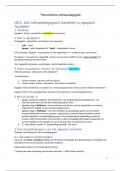
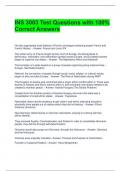
Average Pipe Condition Rating
Do Nothing
2.08
+ 7.2 %
Apply Recommendation
1.93
Pipe Condition distribution based on recommendation
Note: For more details on the recommendation above, please refer to the - Asset
.
*CIPP rehabilitated (not-new pipes) / trenchless rehabilitation method used to repair existing pipelines
iii
,Table of Contents
1.0 Introduction ............................................................................................................................................. 1
2.0 Methodology............................................................................................................................................ 1
2.1 Input Data ............................................................................................................................................ 1
2.2 Data Cleaning ....................................................................................................................................... 2
2.3 Deterioration Model ............................................................................................................................ 5
2.4 Pipe Conditions in 2022 ....................................................................................................................... 9
2.5 Budget Forecast .................................................................................................................................10
2.6 Rehabilitation Costs ...........................................................................................................................11
2.7 Maintenance Costs ............................................................................................................................12
3.0 Level of Service ......................................................................................................................................12
3.1 Safety .................................................................................................................................................12
3.2 Reliability ...........................................................................................................................................13
3.3 Affordability ....................................................................................................................................... 13
3.4 Service Quality ...................................................................................................................................13
4.0 Results .................................................................................................................................................... 15
4.1 Do Nothing Scenario ..........................................................................................................................15
4.2 Scenario 1 Constrained-Budget Single-Objective Optimization Model..........................................16
4.3 Scenario 2 Constrained-Condition Single-Objective Optimization Model .....................................19
4.4 Scenario 3 Multi-objective Optimization Model ............................................................................21
5.0 Discussion ..............................................................................................................................................23
5.1 Model Comparison and Recommendation........................................................................................24
5.2 Qualitative Criteria in Asset Management Policies ...........................................................................24
5.2.1 Health and Safety........................................................................................................................24
5.2.2 State of Good Repair................................................................................................................... 25
5.2.3 Legislation/Municipality's Policy ................................................................................................ 25
5.2.4 Growth-Orientated Mindset ....................................................................................................... 25
6.0 Recommendation to Stakeholders ........................................................................................................ 25
7.0 Project Limitations .................................................................................................................................26
References ...................................................................................................................................................... i
Appendix A Deterioration Models ............................................................................................................. iii
Appendix B Annual Condition Ratings ...................................................................................................... vii
Appendix C Constraint Budget Single Objective Optimization ................................................................ viii
iv
, Appendix D Constraint Condition Single Objective Optimization .............................................................. x
Appendix E Multi-objective optimization model ...................................................................................... xii
Appendix F Initial Pipe Condition in 2013 ................................................................................................. xv
Appendix G - Constraint Budget Single Objective Optimization Cost Breakdown ..................................... xix
Appendix H - Constraint Condition Single Objective Optimization Cost Breakdown................................. xxi
Appendix I Multi-Objective Optimization Model Cost Breakdown ........................................................xxiii
List of Figures
Figure 1. The Average Age of Different Pipe Types After Modifying The Potential Wrong Date. ................ 3
Figure 2. The Total Length of Pipes Network in The Asset Inventory With Nearly 90% of The Sewer
System Consists of CON or VC Pipes ............................................................................................................. 4
Figure 3. The Condition Rating Distribution of The Pipe Types Among Different Age Groups on The
Inspection Date ............................................................................................................................................. 5
Figure 4. All Pipe Age vs. Pipe Condition Rating Under Different Pipe Type Groups ................................... 6
Figure 5. The Relationship Between Pipe Age and Pipe Condition Rating in the Exponential Regression
for CON Pipes ................................................................................................................................................ 6
Figure 6. Deterioration Plots of Sewer Pipes from NRCC ............................................................................. 8
Figure 7. Predicted Average Service Life of Canada Sewer Pipes ................................................................. 8
Figure 8. Forecasted Future Pipe Conditions of Each Type Next Five Years...............................................15
Figure 9. Pipe Condition Rating in Next Ten Years and Policy Rates on Each Pipe Type in Scenario 1 ......18
Figure 10. Rehabilitation Cost VS Budget Cost on Each Pipe Type .............................................................19
Figure 11. Pipe Condition Rating in Next Ten Years and Policy Rates on Each Pipe Type in Scenario 2 ....20
Figure 12. Pipe Condition Rating in Next Ten Years and Policy Rates on Each Pipe Type in Scenario 3 ....23
v
City Hall, 71 Main Street West
Hamilton, Ontario,
Canada L8P 4Y5
BRIEFING NOTE
Sanitary and Stormwater Network Infrastructure Plan
TO: City of Hamilton City Council & Committee
PREPARED BY: University of Toronto CIV1288 Consulting Team - Group 3
DATE: July 22, 2022
ISSUE/BACKGROUND
The City of Hamilton currently has a sanitary, storm and combined sewer network (referred to
of 1,100 km, consisting of over 17,300 pipes constructed from 1900 to 2013.
The average sewer pipe is 66 years old, with more than 61% of the pipes operating for more
than 50 years. The average diameter is 555 mm.
Sewer pipes are inspected via CCTV inspections and are assigned a score from 1 (best) to 5
(worst).
The sewer pipes are made of:
o Vitrified clay (VC) 31%
o Concrete (CON) 50%
o Polyvinyl Chloride (PVC) 4%
o Cured in place pipe (CIPP) 12%
o Other (e.g., brick, steel) 3%
Sewer pipes have a typical useful life of 100 years. However, many pipes have already exceeded
useful life:
o Wastewater 12%
o Storm 6%
Without continued maintenance and necessary rehabilitation, the deterioration within the
sewer pipes would lead to issues including but not limited to:
o Sewer blockage/backups -> Public Health and Safety / Odor / Mold
o Surface Overflow -> Public Health / Flooding / Property Damage / Traffic Congestion
o Drinking Water contamination -> Public Health Impact
o Untreated Sanitary/Storm -> Environmental Impacts
ii
,RECOMMENDATION
To stay within the 10-year budget forecast 2021 Recommended Water, Wastewater and
Stormwater Budget Plan (FCS20073) (City Wide) ), the rehabilitation policies below are
recommended to ensure optimal pipe conditions while staying within the forecasted budget
Due to the natural deterioration and characteristics of the different pipe materials,
rehabilitation policies are provided for each pipe material. Only pipes in conditions 3 (fair), 4
(poor) and 5 (immediate attention) are considered for rehabilitation policy.
Recommended 10-Year Rehabilitation Policy
Pipe Policy (% of pipes to be Avg. Rehab Total Cost* Budget
Type rehabilitated) Condition Cost Forecast
3 4 5 Score
VC 0 0.02% 7.1% 2.35 $61,812 $65,522 $75,363
PVC 1.46% 1.57% 7.51% 1.62 $11,119 $11,832 $14,488
CON 0 2.72% 9.11% 1.82 $145,980 $153,903 $187,202
CIPP 0 5.93% 1.08% 2.32 $9,427 $9,965 $10,937
Total $228,338 $241,222 $287,990
*Total cost includes rehabilitation and maintenance
The Asset Management team is to identify further and prioritize pipes based on their criticality
when developing detailed plans.
Alternative rehabilitation policies and scenarios are available and can be found in the report.
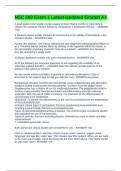
Average Pipe Condition Rating
Do Nothing
2.08
+ 7.2 %
Apply Recommendation
1.93
Pipe Condition distribution based on recommendation
Note: For more details on the recommendation above, please refer to the - Asset
.
*CIPP rehabilitated (not-new pipes) / trenchless rehabilitation method used to repair existing pipelines
iii
,Table of Contents
1.0 Introduction ............................................................................................................................................. 1
2.0 Methodology............................................................................................................................................ 1
2.1 Input Data ............................................................................................................................................ 1
2.2 Data Cleaning ....................................................................................................................................... 2
2.3 Deterioration Model ............................................................................................................................ 5
2.4 Pipe Conditions in 2022 ....................................................................................................................... 9
2.5 Budget Forecast .................................................................................................................................10
2.6 Rehabilitation Costs ...........................................................................................................................11
2.7 Maintenance Costs ............................................................................................................................12
3.0 Level of Service ......................................................................................................................................12
3.1 Safety .................................................................................................................................................12
3.2 Reliability ...........................................................................................................................................13
3.3 Affordability ....................................................................................................................................... 13
3.4 Service Quality ...................................................................................................................................13
4.0 Results .................................................................................................................................................... 15
4.1 Do Nothing Scenario ..........................................................................................................................15
4.2 Scenario 1 Constrained-Budget Single-Objective Optimization Model..........................................16
4.3 Scenario 2 Constrained-Condition Single-Objective Optimization Model .....................................19
4.4 Scenario 3 Multi-objective Optimization Model ............................................................................21
5.0 Discussion ..............................................................................................................................................23
5.1 Model Comparison and Recommendation........................................................................................24
5.2 Qualitative Criteria in Asset Management Policies ...........................................................................24
5.2.1 Health and Safety........................................................................................................................24
5.2.2 State of Good Repair................................................................................................................... 25
5.2.3 Legislation/Municipality's Policy ................................................................................................ 25
5.2.4 Growth-Orientated Mindset ....................................................................................................... 25
6.0 Recommendation to Stakeholders ........................................................................................................ 25
7.0 Project Limitations .................................................................................................................................26
References ...................................................................................................................................................... i
Appendix A Deterioration Models ............................................................................................................. iii
Appendix B Annual Condition Ratings ...................................................................................................... vii
Appendix C Constraint Budget Single Objective Optimization ................................................................ viii
iv
, Appendix D Constraint Condition Single Objective Optimization .............................................................. x
Appendix E Multi-objective optimization model ...................................................................................... xii
Appendix F Initial Pipe Condition in 2013 ................................................................................................. xv
Appendix G - Constraint Budget Single Objective Optimization Cost Breakdown ..................................... xix
Appendix H - Constraint Condition Single Objective Optimization Cost Breakdown................................. xxi
Appendix I Multi-Objective Optimization Model Cost Breakdown ........................................................xxiii
List of Figures
Figure 1. The Average Age of Different Pipe Types After Modifying The Potential Wrong Date. ................ 3
Figure 2. The Total Length of Pipes Network in The Asset Inventory With Nearly 90% of The Sewer
System Consists of CON or VC Pipes ............................................................................................................. 4
Figure 3. The Condition Rating Distribution of The Pipe Types Among Different Age Groups on The
Inspection Date ............................................................................................................................................. 5
Figure 4. All Pipe Age vs. Pipe Condition Rating Under Different Pipe Type Groups ................................... 6
Figure 5. The Relationship Between Pipe Age and Pipe Condition Rating in the Exponential Regression
for CON Pipes ................................................................................................................................................ 6
Figure 6. Deterioration Plots of Sewer Pipes from NRCC ............................................................................. 8
Figure 7. Predicted Average Service Life of Canada Sewer Pipes ................................................................. 8
Figure 8. Forecasted Future Pipe Conditions of Each Type Next Five Years...............................................15
Figure 9. Pipe Condition Rating in Next Ten Years and Policy Rates on Each Pipe Type in Scenario 1 ......18
Figure 10. Rehabilitation Cost VS Budget Cost on Each Pipe Type .............................................................19
Figure 11. Pipe Condition Rating in Next Ten Years and Policy Rates on Each Pipe Type in Scenario 2 ....20
Figure 12. Pipe Condition Rating in Next Ten Years and Policy Rates on Each Pipe Type in Scenario 3 ....23
v