Ch 13 Homework 1
1. Selected comparative financial statements of Haroun Company follow.
HAROUN COMPANY
Comparative Income Statements
For Years Ended December 31, 2019–2013
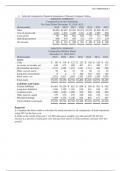
($ thousands) 2019 2018 2017 2016 2015 2014 2013
Sales $2,839 $2,487 $2,263 $2,074 $1,935 $1,800 $1,475
Cost of goods sold 2,042 1,661 1,429 1,251 1,162 1,087 866
Gross profit 797 826 834 823 773 713 609
Operating expenses 608 476 436 322 279 275 229
Net income $ 189 $ 350 $ 398 $ 501 $ 494 $ 438 $ 380
HAROUN COMPANY
Comparative Balance Sheets
December 31, 2019–2013
($ thousands) 2019 2018 2017 2016 2015 2014 2013
Assets
Cash $ 89 $ 118 $ 122 $ 125 $ 130 $ 128 $ 132
Accounts receivable, net 640 672 608 467 411 389 275
Merchandise inventory 2,315 1,685 1,472 1,241 1,114 946 686
Other current assets 59 54 33 59 50 51 26
Long-term investments 0 0 0 182 182 182 182
Plant assets, net 2,832 2,821 2,469 1,392 1,439 1,280 1,099
Total assets $5,935 $5,350 $4,704 $3,466 $3,326 $2,976 $2,400
Liabilities and Equity
Current liabilities $1,491 $1,254 $ 822 $ 684 $ 594 $ 561 $ 362
Long-term liabilities 1,595 1,390 1,352 628 641 694 521
Common stock 1,080 1,080 1,080 960 960 840 840
Other paid-in capital 270 270 270 240 240 210 210
Retained earnings 1,499 1,356 1,180 954 891 671 467
Total liabilities and equity $5,935 $5,350 $4,704 $3,466 $3,326 $2,976 $2,400
Required:
1. Complete the below table to calculate the trend percents for all components of both statements
using 2013 as the base year.
2. Refer to the results from part 1. (a) Did sales grow steadily over this period? (b) Did net
income as a percent of sales grow over the past four years? (c) Did inventory increase over this
period?
, Ch 13 Homework 2
Explanation
2.(a)Sales grew steadily for the entire period of 2013 to 2019. (However, beginning in 2017, cost of goods
sold and operating expenses increased dramatically relative to sales, resulting in a significant reduction in
net income.)
(b)
In 2019, net income was only 49.7% of the 2013 base year amount. Further, that percent was greatest in
2016 at 131.8% and declined in each year since that time.
(c)
Inventory sharply increased over this period
, Ch 13 Homework 3
2. Selected comparative financial statements of Korbin Company follow.
KORBIN COMPANY
Comparative Income Statements
For Years Ended December 31, 2019, 2018, and 2017
2019 2018 2017
462,91
Sales $ $354,630 $246,100
4
Cost of goods 278,67
224,126 157,504
sold 4
184,24
Gross profit 130,504 88,596
0
Selling
65,734 48,939 32,485
expenses
Administrative
41,662 31,207 20,426
expenses
107,39
Total expenses 80,146 52,911
6
Income before
76,844 50,358 35,685
taxes
Income tax
14,293 10,323 7,244
expense
Net income $ 62,551 $ 40,035 $ 28,441
KORBIN COMPANY
Comparative Balance Sheets
December 31, 2019, 2018, and 2017
2019 2018 2017
Assets
Current assets $ 58,992 $ 39,484 $ 52,780
Long-term investments 0 800 3,410
109,55
Plant assets, net 99,729 59,811
7
168,54 140,01
Total assets $ $ $116,001
9 3
Liabilities and Equity
Current liabilities $ 24,608 $ 20,862 $ 20,300
Common stock 69,000 69,000 51,000
Other paid-in capital 8,625 8,625 5,667
Retained earnings 66,316 41,526 39,034
Total liabilities and 168,54 140,01
$ $ $116,001
equity 9 3