Garantie de satisfaction à 100% Disponible immédiatement après paiement En ligne et en PDF Tu n'es attaché à rien
logo-home
Summary Statistics 3 Lectures €7,99
Ajouter au panier

Resume

Summary Statistics 3 Lectures

 1 fois vendu
  • Cours
  • Établissement

Statistics 3 Lectures LECTURE 1: Recapitulation LECTURE 2: ANOVA / Regression LECTURE 3: Factorial ANOVA LECTURE 4: ANCOVA LECTURE 4: Mediation / Moderation LECTURE 6: MANOVA/ Repeated Measures

Aperçu 4 sur 122  pages

  • 15 novembre 2023
  • 122
  • 2022/2023
  • Resume
avatar-seller
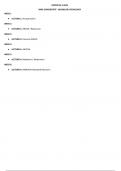
‭STATISTICS 3 2023‬
‭VRIJE UNIVERSITEIT - BACHELOR PSYCHOLOGY‬
‭WEEK 1‬

‭●‬ ‭LECTURE 1:‬‭Recapitulation‬

‭WEEK 2:‬

‭●‬ ‭LECTURE 2:‬‭ANOVA / Regression‬

‭WEEK 3:‬

‭●‬ ‭LECTURE 3:‬‭Factorial ANOVA‬

‭WEEK 4:‬

‭●‬ ‭LECTURE 4:‬‭ANCOVA‬

‭WEEK 5:‬

‭●‬ ‭LECTURE 4:‬‭Mediation / Moderation‬

‭WEEK 6:‬

‭●‬ ‭LECTURE 6:‬‭MANOVA/ Repeated Measures‬

,‭..‬ ‭Lectures 1: RECAPITULATION‬ ‭WEEK 1‬
‭DEFINITION STATISTICS‬
‭●‬ ‭“‬‭Statistics is the science of collecting, organizing and interpreting numerical facts, which we call data‬‭.”‬
‭●‬ ‭Important‬‭matters for the application of statistics‬‭(“Applied Statistics”):‬
‭1.‬ ‭Selecting a sample‬‭from a population‬
‭a.‬ ‭Random vs non-random selection‬
‭2.‬ ‭Deciding whether a sample is‬‭representative‬
‭a.‬ ‭You want to generalize your findings to the population, not just this sample‬
‭3.‬ ‭Deciding between‬‭Descriptive‬‭or‬‭Inferential Statistics‬
‭4.‬ ‭Measurement levels (NOIR)‬‭and‬‭types of variables (categorical/quantitative)‬
‭5.‬ ‭Selecting the correct‬‭statistical analysis‬
‭6.‬ ‭Experimental‬‭versus‬‭non-experimental‬‭research design‬


‭●‬ ‭A&F: Statistics consists of a‬‭body of methods for obtaining and analyzing data‬‭, to:‬
‭1.‬ ‭Design‬ ‭[research studies that‬‭]‬
‭2.‬ ‭Describe‬ ‭[the data to]‬
‭3.‬ ‭Make inferences‬ ‭based on these data.‬
‭Two types:‬

‭Descriptive Statistics‬ ‭Inferential Statistics‬

‭ escriptive‬ ‭statistics‬ ‭summarize‬ ‭sample‬ ‭or‬ I‭nferential‬ ‭statistics‬ ‭make‬ ‭predictions‬ ‭about‬ ‭population‬
D
‭population‬ ‭data‬ ‭with‬ ‭numbers,‬ ‭tables,‬ ‭and‬ ‭graphs‬ ‭parameters, based on a (random) sample of data‬
‭(e.g., box plots)‬ ‭(Estimate population parameter based upon the sample statistic)‬


‭DATA, POPULATION, SAMPLE, RELIABILITY, VALIDITY‬

‭Doing research by means of‬‭data‬‭: observation of characteristics‬

‭Population‬ T‭ he‬‭total set of participants‬‭, relevant for the‬ E‭ .g.‬‭Population parameter‬‭: average hour of self‬
‭research question‬ ‭study per week of‬‭all‬‭students‬‭.‬

‭Sample‬ a‭ ‬‭subset of the population‬‭about who the‬ E‭ .g.‬‭Sample statistic‬‭: average hour of self study‬‭per‬
‭data is collected‬ ‭week of a randomly selected‬‭sample of‬‭800‬
‭students‬


‭Good data is necessary to answer the research question:‬
‭●‬ ‭Reliability‬‭(Precision => consistency!)‬
‭●‬ ‭Validity‬ ‭(Bias)‬

,‭DESCRIPTIVE STATISTICS‬
‭Variables, measurement levels and range‬
‭Variable‬‭:‬‭measures‬‭characteristics‬‭that can‬‭differ‬‭between subjects‬
‭●‬ ‭Types‬‭:‬‭behavior-, stimulus-, subject-, physiological variables‬‭(eg: reaction time, height, level of aggression)‬
‭●‬ ‭Distribution‬‭:‬‭Summary of one variable‬
‭●‬ ‭Association‬‭:‬‭Summary of Multiple Variables‬


‭Measurement scales‬‭(NOIR):‬

‭N‭o
‬ minal‬ ‭ NORDERED‬‭categories, no ordering, no‬ C
U ‭ ountries‬
‭Categorical‬ ‭meaningful distances, no absolute zero‬ ‭Eye color‬
‭ ategorical /‬
C ‭Biological sex‬
‭Qualitative‬
‭O‭r‬ dinal‬ ‭ RDERED‬‭categories, ordering, no‬
O ‭ ancing Skills categorized as “beginners”,‬
D
‭Categorial‬ ‭meaningful distances, no absolute zero‬ ‭“intermediate”, “advanced”‬
‭ point Likert scale from very satisfied to‬
5
‭very dissatisfied‬
‭disagree/neutral/agree‬

‭I‬‭nterval‬ c‭ ategories, ordering, meaningful‬ T‭ emperature in Celsius (because‬
‭Continuous‬ ‭distances (equal distances between‬ ‭Temperature of 0 does not mean ab‬
‭measures), no absolute zero‬ ‭absence of temperature since there is still‬
‭minus temperatures)‬
‭ uantitative/‬
Q
‭Numerical‬ =‭ equal distance between consecutive‬
(‭ „Parametric‬ ‭values‬
‭Methods“)‬
‭R‬‭atio‬ c‭ ategories, ordering, meaningful‬ ‭ istances between 2 cities; Number of‬
D
‭Continuous‬ ‭distances, an absolute zero‬ ‭Years a person has smoked (0 years is‬
‭absence); Age‬
=‭ equal distance and‬‭true zero point =(‬ ‭Kelvin - Temperature‬
‭absence of the characteristic)‬


‭Range‬‭:‬

‭Discrete‬ ‭measurement unit that is indivisible (1 not 1.2)‬ ‭Example: brothers/sisters‬

‭Continuous‬ ‭infinitely divisible measurement unit‬ ‭Example: body height‬


‭Summarized‬

, ‭Graphs of Descriptive Statistics‬

‭Bar Graph‬ ‭Nominal /Ordinal‬ ‭Bars‬‭apart‬‭from each other‬
‭ isplaying‬
D
‭Frequencies of‬
‭categorical data‬


‭Histogram‬ ‭Interval / Ratio‬ ‭ ars‬‭next to‬‭each other (groups are‬
B
‭ isplaying‬
D ‭connected!)‬
‭Frequencies of‬ ‭ ecause can divide groups into fixes‬
B
‭quantitative data‬ ‭sizes such as income of 1000 - 2000‬


‭Pie Chart‬ ‭Categorical data‬ ‭ isplays the share/ percentage per‬
D
‭Nominal / Ordinal‬ ‭category‬
‭ ot suitable for many values (e.g.,‬
N
‭displaying income of 63 employees)‬
‭Not suitable for continuous data‬


‭Line Graph‬ ‭Interval/ Ratio‬ ‭ sed to show “a trend” of two‬
U
‭variables at a ratio level‬


‭Box Plot‬ ‭ isplays center (= by the median) &‬
D
‭variation of data (= box & lines)‬


‭Scatterplot‬ ‭Interval/ Ratio Level‬ ‭ isplays association / relation‬
D
‭between 2 variables: positive/‬
‭negative‬


‭Difference to Line Graph:‬
‭LG: for trends /SP: for relations‬

S‭ team and‬ ‭Quantitative Data‬
‭Leaf Plots‬

Les avantages d'acheter des résumés chez Stuvia:

Qualité garantie par les avis des clients

Qualité garantie par les avis des clients

Les clients de Stuvia ont évalués plus de 700 000 résumés. C'est comme ça que vous savez que vous achetez les meilleurs documents.

L’achat facile et rapide

L’achat facile et rapide

Vous pouvez payer rapidement avec iDeal, carte de crédit ou Stuvia-crédit pour les résumés. Il n'y a pas d'adhésion nécessaire.

Focus sur l’essentiel

Focus sur l’essentiel

Vos camarades écrivent eux-mêmes les notes d’étude, c’est pourquoi les documents sont toujours fiables et à jour. Cela garantit que vous arrivez rapidement au coeur du matériel.

Foire aux questions

Qu'est-ce que j'obtiens en achetant ce document ?

Vous obtenez un PDF, disponible immédiatement après votre achat. Le document acheté est accessible à tout moment, n'importe où et indéfiniment via votre profil.

Garantie de remboursement : comment ça marche ?

Notre garantie de satisfaction garantit que vous trouverez toujours un document d'étude qui vous convient. Vous remplissez un formulaire et notre équipe du service client s'occupe du reste.

Auprès de qui est-ce que j'achète ce résumé ?

Stuvia est une place de marché. Alors, vous n'achetez donc pas ce document chez nous, mais auprès du vendeur bernarditarichards. Stuvia facilite les paiements au vendeur.

Est-ce que j'aurai un abonnement?

Non, vous n'achetez ce résumé que pour €7,99. Vous n'êtes lié à rien après votre achat.

Peut-on faire confiance à Stuvia ?

4.6 étoiles sur Google & Trustpilot (+1000 avis)

69052 résumés ont été vendus ces 30 derniers jours

Fondée en 2010, la référence pour acheter des résumés depuis déjà 15 ans

Commencez à vendre!
€7,99  1x  vendu
  • (0)
Ajouter au panier
Ajouté