Garantie de satisfaction à 100% Disponible immédiatement après paiement En ligne et en PDF Tu n'es attaché à rien
logo-home
Samenvatting theorie Kwantitatieve data-anlyse SPSS €6,49
Ajouter au panier

Resume

Samenvatting theorie Kwantitatieve data-anlyse SPSS

 106 vues  0 fois vendu

Deze samenvatting van data-analyse bevat enkel de theorie, als je de samenvatting wilt van de werkcolleges kan je kijken op mijn pagina. Deze samenvatting is op basis van de ppt én het handboek geschreven door Prof. Pauwels

Aperçu 4 sur 38  pages

  • 16 mai 2018
  • 38
  • 2017/2018
  • Resume
Tous les documents sur ce sujet (2)
avatar-seller
Jozefien
SAMENVATTING SPSS KWANTI - RAPPORTAGE


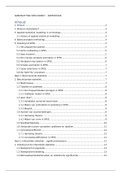
Inhoud
1. Inhoud............................................................................................................................. 2
2. Waarom statistieken?..................................................................................................... 3
3. Applied statistical modelling in criminology....................................................................3
3.1 History of applied statistical modelling......................................................................3
4. Basisconcepten (herhaling)............................................................................................. 4
5. Inleiding tot SPSS............................................................................................................ 5
5.1 Het programma openen............................................................................................. 5
5.2 Korte rondleiding in SPSS..........................................................................................5
5.3 Data invoeren............................................................................................................ 5
5.4 Een nieuwe variabele aanmaken in SPSS..................................................................6
5.5 Variabelen hercoderen in SPSS..................................................................................6
5.6 Schalen aanmaken in SPSS........................................................................................7
5.7 Cases selecteren in SPSS........................................................................................... 7
5.8 De ‘Split File’ procedure.............................................................................................7
Deel 1: Beschrijvende statistiek.......................................................................................... 7
1. Beschrijvende statistiek..................................................................................................7
1.1 Meetniveaus.............................................................................................................. 7
1.2 Tabellen en grafeken................................................................................................8
1.2.1 Een frequentietabel opvragen in SPSS.................................................................8
1.2.2 Grafeken maken in SPSS.....................................................................................8
1.3 geen idee?................................................................................................................. 8
1.3.1 Variabelen numeriek beschrijven........................................................................8
1.3.2 Maten van centraliteit en spreiding in SPSS.........................................................9
1.3.3 Boxplot................................................................................................................ 9
1.4 Vormen van scoreverdelingen...................................................................................9
1.4.1 Herhaling theorie................................................................................................. 9
1.4.2 Maten van vorm in SPSS......................................................................................9
1.5 Standaarddeviatie................................................................................................... 10
1.6 Verbanden tussen variabelen: grafeken en tabellen...............................................11
1.7 Correlatiecoëfciënt................................................................................................. 12
1.7.1 Herhaling theorie............................................................................................... 12
1.7.2 Correlatiecoëfciënten in SPSS..........................................................................12
Deel 2: Inferentiële statistiek – signifcantietoetsen..........................................................13
1. Inleiding tot de inferentiële statistiek............................................................................13
1.1 Steekproef en populatie........................................................................................... 13
1.2 Steekproevenverdeling............................................................................................ 13
1.3 Betrouwbaarheidsintervallen en statistische signifcantie.......................................15

,2. Statistische signifcantie van de correlatiecoëfciënt...................................................16
2.1 Het verwerpen of aanvaarden van de nulhypothese...............................................16
2.2 Statistische signifcantie van de correlatiecoëfciënt in SPSS..................................16
3. T-toets.......................................................................................................................... 16
3.1 De afhankelijke t-toets............................................................................................. 16
3.1.1 Herhaling theorie............................................................................................... 16
3.1.2 De afhankelijke t-toets in SPSS..........................................................................17
3.2 De onafhankelijke t-toets......................................................................................... 17
3.2.1 Herhaling theorie............................................................................................... 17
3.2.2 De onafhankelijke t-toets in SPSS......................................................................18
4. De chikwadraattoets..................................................................................................... 19
4.1 De chikwadraattoets voor twee steekproeven in SPSS............................................21
4.2 Het partitioneren van kruistabellen.........................................................................21
5. De F-toets..................................................................................................................... 21
5.1 Herhaling theorie..................................................................................................... 21
5.2 Varianties opvragen in SPSS....................................................................................22
6. Variantieanalyse (ANOVA)............................................................................................ 23
6.1 De ongecorreleerde één-factor variantieanalyse in SPSS........................................23
6.2 Variantieanalyse voor afhankelijke waarnemingen of herhaalde metingen.............24
Deel 3: correlatiemethoden – factoranalyse en regressie.................................................24
1. Factoranalyse............................................................................................................... 25
1.1 Introductie factoranalyse......................................................................................... 25
1.2 Factoranalyse in SPSS.............................................................................................. 26
1.3 Factoranalyse en multidimensionaliteit...................................................................28
1.4 Cronbach’s alpha..................................................................................................... 28
1.5 Schalen aanmaken.................................................................................................. 29
2. Regressieanalyse.......................................................................................................... 29
2.1 Herhaling correlatie................................................................................................. 29
2.2 Enkelvoudige lineaire regressie...............................................................................30
2.3 Assumpties regressie............................................................................................... 34
2.4 Regressie in SPSS.................................................................................................... 34
2.5 Meervoudige lineaire regressie................................................................................35
EXAMEN............................................................................................................................ 37


1. Inhoud
- Toepassen van kwantitatieve analysetechnieken: uitvoeren van statistische
analyses en datatransformaties via menu-interface;
- Verantwoord kiezen tussen univariate beschrijvende parameters;
- Verantwoord kiezen tussen bivariate parameters: van kruistabellen tot de
regressie, correlatieanalyse en variantie-analyse;

, - Verkennen van de grenzen van bivariate statistiek: het meervoudige lineaire
regressiemodel, de logistische regressie-analyse, beginselen van de factor-
analyse;
- Aanmaken van schalen en evalueren van de schaalbetrouwbaarheid
Eindcompetenties:
- Resultaten van statistische analyses begrijpen, interpreteren en kritisch
evalueren;
- Verantwoord kiezen uit verschillende statistische technieken op basis van het
meetniveau van variabelen;
- Een statistisch model zelfstandig analyseren in SPSS;
- Zelfstandig transformeren en hercoderen van variabelen in SPSS;
- Vertalen van onderzoeksvragen in een statistisch model;
- Interpreteren van statistische signifcantieniveaus en betrouwbaarheidsintervallen.


2. Waarom statistieken?
- Describing data: how many banks get robbed every year?
- Making inferences starting from your data:
o Youth sample: 5% serious ofenders: how would that be in the population of
adolescents?
- Testing hypotheses in the social world: does poverty lead to crime?
- Waarom niet leuk:
o Matematische achtergrond, formules, berkeningen, examples of felds
other then you personal feld of interest


3. Applied statistical modelling in criminology
o Crime & Criminal Justice Statistics: describing crime / victimization /
ofending patterns and series in countries, regions, cities or
neighbourhoods
o Exploratory Analysis: exploring patterns that lead to the formulation of
hypotheses
o Explanatory Analysis: explaining diferences or changes using variables
derived from theories
o Primary data vs. secondary data:
 Primary: the data are collected by the researcher and the aim is to
conduct scientifc research
 Secondary: the data are collected by a scientist for scientifc
purpose, but the scientist can make use of them
o E.g.: data form administration on poverty: can be used to conduct
research, but are especially gathered for knowing how many people live on
welfare

3.1History of applied statistical modelling
- In the good old days
o You punched cards to run your statistics
o Sat at a terminal for a main frame and wrote syntax that wouldn’t work if
you left of a comma
o Went to dinner while your PC churned away at the data
o You used text editors to enter data
 That has all changed now
- Why use SPSS instead of other good programs: SAS, Stata, Mplus, R,..

, o Diferent versions of SPSS
 Spss has undergone quite some improvement
 Which version?
 Some problems were reported in old versions
 Signifcant improvement has been made since version 13
(graphs, complex models)
 SPSS has bevome IBM-SPSS
 In the book we use SPSS 19
 In this course we use SPSS 25
- What is statistical software?
o Powerfull tool allowing you to
 Create and use data bases
 Conduct simple analyses such as mean, mode and median
calculation
 Conduct more complex analyses such as regression models, factor
analysis and other ‘tools of the trade”
 Visualize the distribution (e.eg. bar chart, box plot,..) of variables
and relations between variables (e.g. scatterplot)
 Perform hypothesis testing (making inferences)
o Is not:
 Magic, because a program only performs what you have asked it to
do
 Intelligent: because you have to make the substantial interpretation
yourself.
 Cheap: prices range from 200-16000 USD (depending on options
chosen)


4. Basisconcepten (herhaling)
- Statistical units (cases): are the units we want to say something about
o These units can be of different aggregation level (individuals in surveys,
neugbourhood crime rates,…)
- Variables: characteristics of statistical units that can take several values (e.g.
repeated victimization: 3 times, 4 times,..)
- Variables and units are what statistical analysis is all about
- Dependent variables vs. independent variables
o Dependent: outcome variable  eg how many times did you steal
something from a shop;
o The score on the outcome variable is dependent on the score on (an)
independent variable(s) – e.g.: “How many times have you beaten op
someone – I act before I think
o Cf. hypothesis derived from self-control theory: low self-control  violent
ofending
- Asymmetric vs. symmetric relations
o Asymmetric: causal analysis
o Symmetric: covariance, no causality
o Some techniques are used to study asymeetric relationships, others to
study symmetric relationships
o You ALWAYS need to choos the appropriate technique: i.e. the best
technique of analysis that’ fts the research problem best

Les avantages d'acheter des résumés chez Stuvia:

Qualité garantie par les avis des clients

Qualité garantie par les avis des clients

Les clients de Stuvia ont évalués plus de 700 000 résumés. C'est comme ça que vous savez que vous achetez les meilleurs documents.

L’achat facile et rapide

L’achat facile et rapide

Vous pouvez payer rapidement avec iDeal, carte de crédit ou Stuvia-crédit pour les résumés. Il n'y a pas d'adhésion nécessaire.

Focus sur l’essentiel

Focus sur l’essentiel

Vos camarades écrivent eux-mêmes les notes d’étude, c’est pourquoi les documents sont toujours fiables et à jour. Cela garantit que vous arrivez rapidement au coeur du matériel.

Foire aux questions

Qu'est-ce que j'obtiens en achetant ce document ?

Vous obtenez un PDF, disponible immédiatement après votre achat. Le document acheté est accessible à tout moment, n'importe où et indéfiniment via votre profil.

Garantie de remboursement : comment ça marche ?

Notre garantie de satisfaction garantit que vous trouverez toujours un document d'étude qui vous convient. Vous remplissez un formulaire et notre équipe du service client s'occupe du reste.

Auprès de qui est-ce que j'achète ce résumé ?

Stuvia est une place de marché. Alors, vous n'achetez donc pas ce document chez nous, mais auprès du vendeur Jozefien. Stuvia facilite les paiements au vendeur.

Est-ce que j'aurai un abonnement?

Non, vous n'achetez ce résumé que pour €6,49. Vous n'êtes lié à rien après votre achat.

Peut-on faire confiance à Stuvia ?

4.6 étoiles sur Google & Trustpilot (+1000 avis)

61231 résumés ont été vendus ces 30 derniers jours

Fondée en 2010, la référence pour acheter des résumés depuis déjà 15 ans

Commencez à vendre!
€6,49
  • (0)
Ajouter au panier
Ajouté