Garantie de satisfaction à 100% Disponible immédiatement après paiement En ligne et en PDF Tu n'es attaché à rien
logo-home
Solutions Manual Modeling and Analysis of Dynamic Systems 3rd edition ByRamin S. Esfandiari, Bei Lu €24,15   Ajouter au panier

Examen

Solutions Manual Modeling and Analysis of Dynamic Systems 3rd edition ByRamin S. Esfandiari, Bei Lu

 0 vue  0 fois vendu
  • Cours
  • System admin
  • Établissement
  • System Admin

Solutions, Solutions Manual Modeling and Analysis of Dynamic Systems 3rd edition By Ramin S. Esfandiari, Bei Lu. ISBN. 9781315191294. Edfandiari 3e Modeling and Analysis of Dynamic Systems solutions manual.

Aperçu 4 sur 538  pages

  • 24 janvier 2024
  • 538
  • 2018/2019
  • Examen
  • Questions et réponses
  • System admin
  • System admin
avatar-seller
SOLUTION MANUAL

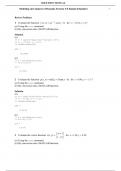
Modeling and Analysis of Dynamic Systems 3/E Ramin Esfandiari 1


Review Problems

=
1 Evaluate the function f ( x, y ) 23 e − x /2 cos( y − 1) for x =
−0.23, y =
2.7
(a) Using the subs command.
(b) By conversion into a MATLAB function.

Solution
(a)
>> f = sym('2*exp(-x/2)*cos(y-1)/3');
>> x = -0.23; y = 2.7;
>> double(subs(f))

ans =

-0.0964

(b)
>> F = matlabFunction(f);
>> F(-0.23,2.7)

ans =

-0.0964


2 Evaluate the function g ( x, y ) =sin(2 x + 1) tan( y − 12 ) for x = 0.45, y = −1.17
(a) Using the subs command.
(b) By conversion into a MATLAB function.

Solution
(a)
>> g = sym('sin(2*x+1)*tan(y-1/2)');
>> x = 0.45; y = -1.17;
>> double(subs(g))

ans =

9.5076

(b)
>> G = matlabFunction(g);
>> G(0.45,-1.17)

ans =

9.5076


 xy + 1 
3 Evaluate the vector function v( x, y ) =   = =
for x 1.54, y 2.28
x − 2 y
(a) Using the subs command.
(b) By conversion into a MATLAB function.

, 2


Solution
(a)
>> v = sym('[x*y+1;x-2*y]');
>> x = 1.54; y = 2.28;
>> double(subs(v))

ans =

4.5112
-3.0200

(b)
>> V = matlabFunction(v);
>> V(1.54,2.28)

ans =

4.5112
-3.0200


 y 3x − y 
4 Evaluate the matrix function m( x, y ) =   for x =
−2, y =
3.35
 x + 1 sin 2 y 
(a) Using the subs command.
(b) By conversion into a MATLAB function.

Solution
(a)
>> m = sym('[y 3*x-y;x+1 sin(2*y)]');
>> x = -2; y = 3.35;
>> double(subs(m))

ans =

3.3500 -9.3500
-1.0000 0.4048

(b)
>> M = matlabFunction(m);
>> M(-2,3.35)

ans =

3.3500 -9.3500
-1.0000 0.4048


5 If f (t ) = e −3t /5 + t ln(t + 1) , evaluate df / dt when t = 4.4
(a) Using the subs command.
(b) By conversion into a MATLAB function.

, 3

Solution
(a)
>> f = sym('exp(-3*t/5)+t*log(t+1)');
>> df = diff(f); t = 4.4;
>> double(subs(df))

ans =

2.4584

(b)
>> dF = matlabFunction(df);
>> dF(4.4)

ans =

2.4584


6 If g= ( x) 23 x −1 + e − x cos x , evaluate dg / dx when x = 1.37
(a) Using the subs command.
(b) By conversion into a MATLAB function.

Solution
(a)
>> g = sym('2^(3*x-1)+exp(-x)*cos(x)');
>> dg = diff(g); x = 1.37;
>> double(subs(dg))

ans =

17.6539

(b)
>> dG = matlabFunction(dg);
>> dG(1.37)

ans =

17.6539


7 Solve the following initial-value problem, and evaluate the solution at x = 3.5 .

′ + xy 2 x , =
( x − 1) y= y (2) 1
Solution
>> y = dsolve('(x-1)*Dy+x*y=2*x','y(2)=1','x');
>> y = matlabFunction(y); y(3.5)

ans =

1.9107

, 4


8 Solve the following initial-value problem, and evaluate the solution at t = 2.8 .

tx + x =et , x(1) =−1
Solution
>> x = dsolve('t*Dx+x=exp(t)','x(1)=-1');
>> x = matlabFunction(x); x(2.8)

ans =
4.5451


9 Plot y1 (t ) = e − t /3 cos( 12 t ) and y2 (t )= (t + 1)e − t versus 0 ≤ t ≤ 10 in the same graph. Adjust the
limits on the vertical axis to −0.3 and 1.1 . Add grid and label.

Solution
>> syms t
>> y1 = exp(-t/3)*cos(t/2); y2 = (t+1)*exp(-t);
>> ezplot(y1,[0,10])
>> hold on
>> ezplot(y2,[0,10])


1


0.8
y2
y1
0.6


0.4


0.2


0


-0.2

0 1 2 3 4 5 6 7 8 9 10
t


Figure Review1No9


10 Plot x1,2,3 (t ) = e − at /2 sin( 13 t ) , corresponding to a = 1, 2,3 , versus 0 ≤ t ≤ 5 in the same graph.
Adjust the limits on the vertical axis to −0.05 and 0.3 . Add grid and label.

Solution
>> syms t
>> x1 = exp(-t/2)*sin(t/3);
>> x2 = exp(-t)*sin(t/3);
>> x3 = exp(-3*t/2)*sin(t/3);
>> ezplot(x1,[0,5])
>> hold on
>> ezplot(x2,[0,5])
>> hold on
>> ezplot(x3,[0,5])

Les avantages d'acheter des résumés chez Stuvia:

Qualité garantie par les avis des clients

Qualité garantie par les avis des clients

Les clients de Stuvia ont évalués plus de 700 000 résumés. C'est comme ça que vous savez que vous achetez les meilleurs documents.

L’achat facile et rapide

L’achat facile et rapide

Vous pouvez payer rapidement avec iDeal, carte de crédit ou Stuvia-crédit pour les résumés. Il n'y a pas d'adhésion nécessaire.

Focus sur l’essentiel

Focus sur l’essentiel

Vos camarades écrivent eux-mêmes les notes d’étude, c’est pourquoi les documents sont toujours fiables et à jour. Cela garantit que vous arrivez rapidement au coeur du matériel.

Foire aux questions

Qu'est-ce que j'obtiens en achetant ce document ?

Vous obtenez un PDF, disponible immédiatement après votre achat. Le document acheté est accessible à tout moment, n'importe où et indéfiniment via votre profil.

Garantie de remboursement : comment ça marche ?

Notre garantie de satisfaction garantit que vous trouverez toujours un document d'étude qui vous convient. Vous remplissez un formulaire et notre équipe du service client s'occupe du reste.

Auprès de qui est-ce que j'achète ce résumé ?

Stuvia est une place de marché. Alors, vous n'achetez donc pas ce document chez nous, mais auprès du vendeur docusity. Stuvia facilite les paiements au vendeur.

Est-ce que j'aurai un abonnement?

Non, vous n'achetez ce résumé que pour €24,15. Vous n'êtes lié à rien après votre achat.

Peut-on faire confiance à Stuvia ?

4.6 étoiles sur Google & Trustpilot (+1000 avis)

79650 résumés ont été vendus ces 30 derniers jours

Fondée en 2010, la référence pour acheter des résumés depuis déjà 14 ans

Commencez à vendre!
€24,15
  • (0)
  Ajouter