Macro economie
Examen: één artikel waarop je de theorieën moet toepassen. Voorbeeld
examenvragen op het einde van de modules. Meeste punten op open vragen
(zelf dingen tekenen), 5-6 meerkeuzevragen met 5/6 punten (met giscorrectie).
Hoofdstuk 1: measuring a nation’s well-being and the price level
(chapter 20 boek)
Overheidsuitgaven zijn niet gelijk aan overheidsbestedingen. Uitgaven liggen
veel hoger dan bestedingen, hierin zitten nog veel andere dingen opgenomen
zoals interest op schulden, sociale zekerheid.
1. The nature of macroeconomics
Macroeconomics is the study of the economy as a whole. Its goal is to
explain the economic changes that affect many households, firms, and
markets at once. They answers questions such as (geen examenleerstof):
o Why is average income high in some countries and low in others?
We bekijken deze vraag met BBP PER CAPITA om grote en kleine
landen te vergelijken. Dingen die invloed hebben hierop: Politieke
stabiliteit, kapitaal goederen, geografie, scholingsniveau,
aanwezigheid van grondstoffen, technologie, ...
o Why do prices rise rapidly in some time periods while they are more
stable in others?
Door inflatie: oorlogssituaties en monetair beleid en de vraag en
prijs van grondstoffen
o Why do production and employment expand in some years and
contract in others?
Door business cycles met groei en inkrimping, …
2. The economy’s income and expenditure
Total income must be equal to expenditure because:
o Every transaction has a buyer and a seller.
o Every euro of spending by some buyer is a euro of income for some
seller.
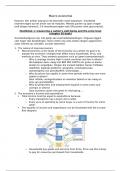
The equality of income and expenditure can be illustrated with the circular-
flow diagram:
o Households buy goods and services from firms; firms use this money
to pay for resources purchased from households.
, o When households receive income, some of the income is saved (S)
providing funds for financial institutions. Some is taxed (T). The
taxes can be used by the government in making purchases (G) such
as education, health and infrastructure.
o Some products and services may be purchased from other countries
as imports (M) and some services and products maybe sold abroad
as exports (X).
o There is also Net Capital outflow, dit is het verschil tussen hoeveel je
land investeert in het buitenland (met bijvoorbeeld multinational
bedrijven) en hoeveel er binnenkomt van jouw bedrijven in het
buitenland.
o Some businesses will invest (I) in new capital.
o Leakages are Taxes + Saved + Import
o Injections into the economy come from purchases, Export and
Investment
3. The measurement of Gross domestic product (BBP)
Gross domestic product (GDP) = Bruto binnenlands product (BBP) is a
measure of the income and expenditures of an economy. It is the total
market value of all final goods and services produced within a country in a
given period of time.
o Market value: output is valued at market prices
o Of all final: it records only the value of final goods, not intermediate
goods (goederen die we aankopen ergens opplakken en verkopen
tellen NIET mee).
o Goods and services: It includes both tangible goods and intangible
services.
o Produced: it includes goods and services produced in the period
we’re considering, not transactions involving goods produced in the
past.
o Within a country: it measures only the value of production within the
country
o In a given period of time: it measures withing a specific period.
Gross national product (GNP) = bruto nationaal product (BNP) is the total
income earned by a nation’s permanent residents.
o Verschil is dat dit alles geproduceerd is door “Belgische” bedrijven,
dus multinationals zoals pfizer van amerika dat hier werken binnen
de grenzen laten we hierbij weg. Ab-inbev fabriek in Amerika telt wel
mee want is Belgisch bedrijf.
4. The components of GDP
GDP includes all items produced in the economy and sold legally in
markets.
GDP (Y) is the sum of the following:
o Consumption (C): The spending by households on goods and
services, with the exception of purchases of new housing because
this is an investment.
o Investment (I): The spending on capital equipment, inventories, and
structures, including new housing.
, o Government Purchases (G): The spending on goods and services by
local and central governments. Does not include transfer payments
(sociale zekerheid en interesten op schulden) because they are not
made in exchange for currently produced goods or services.
o Net Exports (NX): Export – import
When comparing countries we use GDP per capital.
5. Real versus nominal GDP
Why Total Spending can Rise from Year to Year:
o The economy may be producing a larger output of goods and
services.
o Goods and services could be selling at higher prices.
Real GDP values the production of goods and services at constant prices. It
takes changes in price over time into account. (dus deze corrigeert voor
inflatie, etc en is beter om stijgingen doorheen de tijd te meten)
GDP at constant prices uses prices that existed in the base year.
Nominal GDP values the production of goods and services at current
prices. Calculated by multiplying output by prices.
o Wanneer real GDP = Nominal BBP -> zit je in het “basisjaar”
o Voor het basisjaar: het real gdp hoger want hier rekent het nominaal
gdp * inflatie in 2005 (inflatie 2005 > 1970).
o Na het basisjaar: het real gdp lager want hier rekent het nominaal
gdp * inflatie 2005 (inflatie 2005 < 2010)
o Voorbeeld calculatie:
The GDP deflator: KIJKT ENKEL NAAR INFLATIE AAN PRODUCTIEZIJDE
o Verschil tussen dit en CPI, hierin zit geen import bij de CPI wel.
, o The GDP deflator is a measure of the price level calculated as the
ratio of nominal GDP to real GDP times 100. It tells us the rise in
nominal GDP that is attributable to a rise in prices rather than a rise
in the quantities produced.
Dus: het is een index dat dimensieloos is en geen waarde
heeft, basisjaar bepaald waar 100 is. Het vertelt ons in welke
mate er inflatie is aan de productiezijde.
o Berekening voor inflatie productiezijde:
171 – = 71% inflatie
240 – = 40 % inflatie
6. The Limitations Of GDP As A Measure Of Economic Well-being:
Well being (welzijn) refers to measures of the quality of life and uses
indicators such as educational attainment, measures of the standard of
living, life expectancy.
o Er is weldegelijk een positief verband tussen welvaart (hoger
inkomen) en welzijn.
GDP is the best single measure of the economic well-being of a society.
o GDP per person tells us the mean income and expenditure of the
people in the economy.
o Higher GDP per person indicates a higher standard of living.
But it is not perfect because it does not measure: The value of leisure
(vrijetijd), The value of a clean environment, the distribution of income &
the value of almost all activity that takes place outside of markets, such as
the value of the time parents spend with their children and the value of
volunteer work.
That’s why there is now a Gross national happiness index (GNP)
7. International differences in GDP and the quality of life:
Je kan wel duidelijk verschillen zien tussen ontwikkelingen, maar
internationale investeringen in een land kunnen een vertekend beeld
geven en de welvaart opblazen.
8. Measuring the cost of living
The cost of living refers to how much money people need to maintain
certain standards of living in terms of the goods and services they can
afford to buy.
Inflation is the term used to describe a situation in which the economy’s
overall price level is rising. The inflation rate is the percentage change in
the price level from the previous period
9. The consumer price index (CPI) (MEET INFLATIE LANGS CONSUMENTEN ZIJDE)
measures the overall cost of the goods and services bought by a typical
consumer.
o It is used to monitor changes in the cost of living over time.
o When it rises, the typical family has to spend more money to
maintain the same standard of living.
Gezondheidsindex = consumptieprijsindex – alle ongezonde producten
zoals alcohol, tabak, ..
Kerninflatie = consumptieprijsindex – energieproducten en onbewerkte
voedingsmiddelen.
o Hoe cpi berekenen?