Stats HW1,2,3.5,6,7 and 10 | Questions and Answers
10 vues 0 fois vendu
Cours
Statistics
Établissement
Statistics
Stats HW1,2,3.5,6,7 and 10 | Questions and Answers
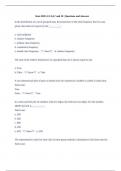
In the distribution of a set of grouped data, the proportion of the total frequency that is in any given class interval is given by the __________.
Stats HW1,2,3.5,6,7 and 10 | Questions and Answers
In the distribution of a set of grouped data, the proportion of the total frequency that is in any
given class interval is given by the __________.
a. class midpoint
b. relative frequency
c. median class frequency
d. cumulative frequency
e. modal class frequency ** Answ** b. relative frequency
The sum of the relative frequencies of a grouped data set is always equal to one.
a. True
b. False ** Answ** a. True
A two-dimensional plot of pairs of points from two numerical variables is called a scatter plot.
Select one:
True
False ** Answ** True
In a stem and leaf plot of numbers with five digits, the stem has two digits. For the number,
48209, the leaf is __________.
Select one:
a. 209
b. 482
c. 096
d. 426
e. 420 ** Answ** a. 209
The representative value for each class in most group statistics calculations is the class interval.
Select one:
,True
False ** Answ** False
A vertical bar chart that displays the frequency of observations ranked in order of occurrence
from left to right is called a relative frequency histogram.
Select one:
True
False ** Answ** False
A cumulative frequency distribution is also called an ogive.
Select one:
True
False ** Answ** True
A graphical mechanism for examining the relationship between two numerical variables is called
a __________.
Select one:
a. dot plot
b. cause-and-effect diagram
c. scatter plot
d. pie chart
e. stem and leaf plot ** Answ** c. scatter plot
The range of a data set is defined as the difference between the mean and the median.
Select one:
True
False ** Answ** False
The difference between the smallest and largest numbers of a data set is the __________.
Select one:
a. deviation
, b. class frequency
c. range
d. average
e. variation ** Answ** c. range
HW 2
In recent years, due to low interest rates, many homeowners refinanced their home mortgages.
Below is the amount refinanced for 20 loans processed last week. The data are reported in
thousands of pounds and arranged from smallest to largest.
Question: What is the 26th percentile? (use two decimal places) ** Answ** 72.90
The mean of a distribution is 43, the median is 45, and the mode is 48. It is most likely that this
distribution is ___________ .
Select one:
a. symmetrical
b. asymptotic
c. leptokurtic
d. positively skewed
e. negatively skewed ** Answ** e. negatively skewed
Suppose that IQ scores have a bell-shaped distribution with a mean of 100 and a standard
deviation of 15.
Question: What percentage of people have an IQ score between 85 and 115?
(Please answer in the format xx e.g. '55' for 55%). ** Answ** 68
Les avantages d'acheter des résumés chez Stuvia:
Qualité garantie par les avis des clients
Les clients de Stuvia ont évalués plus de 700 000 résumés. C'est comme ça que vous savez que vous achetez les meilleurs documents.
L’achat facile et rapide
Vous pouvez payer rapidement avec iDeal, carte de crédit ou Stuvia-crédit pour les résumés. Il n'y a pas d'adhésion nécessaire.
Focus sur l’essentiel
Vos camarades écrivent eux-mêmes les notes d’étude, c’est pourquoi les documents sont toujours fiables et à jour. Cela garantit que vous arrivez rapidement au coeur du matériel.
Foire aux questions
Qu'est-ce que j'obtiens en achetant ce document ?
Vous obtenez un PDF, disponible immédiatement après votre achat. Le document acheté est accessible à tout moment, n'importe où et indéfiniment via votre profil.
Garantie de remboursement : comment ça marche ?
Notre garantie de satisfaction garantit que vous trouverez toujours un document d'étude qui vous convient. Vous remplissez un formulaire et notre équipe du service client s'occupe du reste.
Auprès de qui est-ce que j'achète ce résumé ?
Stuvia est une place de marché. Alors, vous n'achetez donc pas ce document chez nous, mais auprès du vendeur smartchoices. Stuvia facilite les paiements au vendeur.
Est-ce que j'aurai un abonnement?
Non, vous n'achetez ce résumé que pour €9,11. Vous n'êtes lié à rien après votre achat.