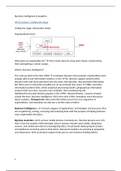
What does an organization do? they create value by using some inputs, transforming
them and getting a certain output.
What is business intelligence?
The roots go back to the late 1960s computers became more popular; organizations were
actually able to use information systems. In the 1970s, decision support systems (DSS)
became more and more advanced over the years. But basically, they provided information
but there was no interaction possible yet. As we proceed over years; in 1980s, executive
information systems (EIS), online analytical processing (OLAP), geographical information
systems (GIS) and more, became more available. Data warehousing and
dashboard/scorecards became popular in the 1990s. Howard Dresner, a Garner Analyst,
coined the term ‘business intelligence’ (BI) in the early 1990s. Nowadays more discussion
about analytics. Changed role: Data and information used to be very supportive in
organizations, and nowadays we also see a certain value creation.
Business intelligence is A broad category of applications, technologies and processes that
aim at gathering, sorting, accessing and analyzing data with the purpose of helping business
users make better decisions.
Big data revolution: all of us have mobile phones, Facebook etc. the data became very rich,
that is how the analytics field emerged. Source systems include social media, ubiquitous
sensors, and clickstream data (increasingly Big Data). Cloud-based Hadoop/Spark clusters
and appliances are being used as data stores. Advanced analytics are growing in popularity
and importance, both as decision support tools and as core business building blocks.
1
,Woerner & Wixom (2015)
From supportive information systems, to new and more value creating business information
systems. Source of value: four v’s, High: volume, velocity, variety, veracity.
Volume: available in much larger amounts (e.g. clickstream data), velocity: the speed with
which data becomes available, variety: we have much more data about different types of
activities, veracity: the truthfulness of the data. If you have more data, then you can use
traditional approaches in order to analyze that data.
What is meant by analytics? there are three levels of analytics:
o Descriptive analytics (similar to the traditional BI function)
o Predictive analytics (new types of business intelligence)
o Prescriptive analytics
Descriptive analytics
We have some sales data, some costs data based on that we can make a profit-loss
statement. Simply focusing on the question: what has occurred? How did we do in the past
…? It is basically the traditional BI function. What happened? Why did it happen? What
exactly is the problem? Query/drill down, ad hoc reporting, standard reporting, statistical
analysis.
Predictive analytics
Focus on the question: what will occur? Customers have a credit with an organization;
organization wants to predict which of their customers are risks for them. Then we try to
predict what will happen. You use existing data and try to make predictions using a
reference data set. What could happen? What if these trends continue? What will happen
next …? Forecasting, simulation, predictive modelling, alerts.
Prescriptive analytics
Focus on the question: what should occur? Here you let analytics define your strategy.
Basically, the distinguishing element which takes place on the more strategic level what
should we do? How to shape the future? How can we achieve the best outcome? What
actions are needed? When? Why? How can we account for the effects of variability?
(stochastic) optimization.
2
,Lavalle et al. (2010)
They make a distinction between three different capability levels.
1. Aspirational we want to do something with data analytics, but we don’t have a
clue as to what we can do, what types of tools/data we can use.
2. Experienced organizations that already tried to implement data analytics in the
organizational structure.
3. Transformed organization that has embraced analytics and really uses it in its
strategy formulation.
Two important take-away messages from this article:
o Everyone can use data, everyone can develop capabilities to develop these data; just
analyzing data because we have the tools, doesn’t make sense, you need to have
specific questions.
o You need to get the organization ready, embed the analytics function in an
organization; organizational change.
Key obstacle: lack of understanding how to leverage analytics for business value, on all three
levels (aspirational, experienced and transformed).
Recommendations for implementation BI
o Within each opportunity, start with questions, not data A clear business need
o Focus on the biggest and highest value opportunities Be a vocal supporter, strong,
committed sponsorship, link incentives and compensation to desired behaviors
o Embed insights to drive actions and deliver value alignment between the business
and IT Strategy; ask to see what analytics went into decisions; a strong data-
infrastructure; the right analytical tools
3
, o Keep existing capabilities while adding new ones recognize that some people
can’t or won’t adjust; stress that outdated methods must be discontinued; strong
analytical people in an appropriate organizational structure
o Use an information agenda to plan for the future
What type of knowledge is required for
advanced analytics? there are many
different roles in this topic area. But in
general people should have knowledge
about either the business domain,
modeling or data.
Modelling
Data scientist is someone who uses raw
data, brings the data, prepares for analysis,
has some tools to visualize the data. Uses advanced algorithms and interactive exploration
tools to uncover non-obvious patterns in data.
Involved in (Donoho, 2017):
Data exploration and preparation
Data representation and transformation
Computing with data
Data modelling
Data visualization and representation
Science about data science
Business Domain
Business analyst uses business intelligence tools and applications to understand and
improve business conditions and business processes.
Involved in:
Business development Identification of business needs and opportunities
Business model analysis
Process design
Systems analysis Interpretation of business rules and developing system
requirements
If you have these different roles, the question arises: where to put the analytics team?
basically the idea is to plant these individuals spread throughout the organization; and then
at one point you can put them in a standalone unit or in some form of cross-functional
competence center.
Parmar et al. (2014)
This paper dives into the question: what do organizations actually do with data analytics?
4
Les avantages d'acheter des résumés chez Stuvia:
Qualité garantie par les avis des clients
Les clients de Stuvia ont évalués plus de 700 000 résumés. C'est comme ça que vous savez que vous achetez les meilleurs documents.
L’achat facile et rapide
Vous pouvez payer rapidement avec iDeal, carte de crédit ou Stuvia-crédit pour les résumés. Il n'y a pas d'adhésion nécessaire.
Focus sur l’essentiel
Vos camarades écrivent eux-mêmes les notes d’étude, c’est pourquoi les documents sont toujours fiables et à jour. Cela garantit que vous arrivez rapidement au coeur du matériel.
Foire aux questions
Qu'est-ce que j'obtiens en achetant ce document ?
Vous obtenez un PDF, disponible immédiatement après votre achat. Le document acheté est accessible à tout moment, n'importe où et indéfiniment via votre profil.
Garantie de remboursement : comment ça marche ?
Notre garantie de satisfaction garantit que vous trouverez toujours un document d'étude qui vous convient. Vous remplissez un formulaire et notre équipe du service client s'occupe du reste.
Auprès de qui est-ce que j'achète ce résumé ?
Stuvia est une place de marché. Alors, vous n'achetez donc pas ce document chez nous, mais auprès du vendeur annefleur1998. Stuvia facilite les paiements au vendeur.
Est-ce que j'aurai un abonnement?
Non, vous n'achetez ce résumé que pour €5,49. Vous n'êtes lié à rien après votre achat.