Lecture 1
What is the difference between population and sample?
Population
• Parameters: Variables (numbers), which characterize the properties of the population in Greek letters
o μ (mu) = mean of a property of the population;
o σ (sigma) = standard deviation of a property of the population
Sample
• Why is sample important?
o subset of the population used to draw conclusions about the entire population.
• Parameters are called statistics
o Sample: X (mean) and s (standard deviation)
• One sample is a limited number of elements from one population.
Data types
• Categorical data:
o what is categorical data?
Data which is qualitative (no numbers) by nature
o Kinds
Nominal ( )اسمىscale
classification only , no ranking
o E.g. Blood groups (A, B, AB, O)
Ordinal ( )ترتيبيscale
classification and rank orderapple
• Numerical data:
o What is numerical data?
(Continuous, quantitative); measurement with numbers
o Kinds
Interval scale
measurement with fixed unit; null point is arbitrarily chosen
o E.g. temperature in Celsius or Fahrenheit or Kelvin
Ratio scale
fixed unit; fixed null point
o 200 km/h is twice as fast as 100 km/h
Censored data
Other things
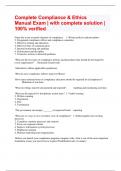
What is the difference between probability distribution and frequency distribution?
• Red line represent the population no uncertainty here
• Blue bars represent the sample there is a degree of uncertainty
,Additional information
The mode is the most frequent value
The median is the middle value.
The mean is the sum of all figures divided by the number of figures.
Which-test-for-what-question troubleshoot
1. Read and analyze the question FIRST!
2. See which type of data is given → is it frequency/ scale data?
3. Are the values NORMAL or NON-PARAMETRIC (will be stated if non-parametric) → if not
stated, assume normal (sample size is large enough → CLT)
4. If normal, proceed with t- test → check if data are paired (related) or independent
5. If independent → check if t-test condition is MET → F test needs to be valid then can
proceed
**in case of F test fail, data is considered to be non-parametric**
NB: please always start the question with Null/Alternative Hypothesis (mark will be awarded)
,
,Lecture 2
Tips to approach probability question:
1. Analyze the given variables 🡪 let A be the first event… / B be the second event…
2. Write down the info known in numerical value 🡪 convert from %
3. Understand problem given in probability notation 🡪 conditional probability phrase indication: “of this sample [outcome
A], [probability] has also [outcome B]….
4. Use appropriate equation given
Independent probabilities
Dependent probabilities
Parametric and non-parametric distribution
What is the difference between parametric and non-parametric distribution?
o Parametric statistical analysis: Assumption ( )افتراضthat observations in a sample originate from
population
o Non-parametric: No assumption about the underlying distribution is necessary
,Probability distribution with discrete (fixed) outcomes
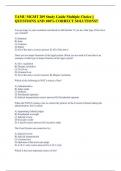
Uniform probability
equal and unbiased probability for a particular event
Binomial probability
Categorical data with 2 properties/characteristics A and B; dichotomy
Basic
Parameters
Proportion 𝝅 (pi): Each object has the probability 𝜋 to have property A and the probability (1 − 𝜋) to have
property B
Sample size: 𝑛 objects which belong to groups A or B
The probability to have precisely 𝑥 objects with property A is
Steps to answer the question
1. Based on the question you determine how to solve it?
a. Normally they ask about what the event’s probability in which X is larger smaller than a specific number
i. E.g. what is the probability that pations does not have money to pay there treatment
b. Therefore: you have to calculate the probability one by one
c. Sum the probabilities up
d. 1-the sum of probabilities
Poisson distribution
Random (rare) events occurring incidentally in fixed time or space
Basic
Parameters
Average number of events per time or space =
𝑥 events occur per time- or space-unit
,Lecture 3
Steps to approach a typical normal distribution question
1. Analyze the question first → find out what is μ∧σ given in the qn
2. Express the data in the form of X N ( μ , σ 2 )
3. Perform standardization (see formula below)
4. Check Z value in 2a (one-sided) or 2b (two-sided) → based on what is asked
5. Do interpolation (if needed) → give corresponding p value
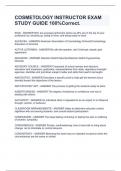
Normal distribution
Standardization
Role
( X −μ)
o Z=
σ
X = given value
If given data set is not normally distributed → possible to approximate to normal distribution
when n (sample size) > 30
,Difference between 2 sample means
,Lecture 4
Confidence interval
Confidence interval
Hypothesis testing
H0 → usually it is a commonly accepted / taken to be true statement in the context of the question
H1 → alternative hypothesis → contentious claim that we want to prove the accuracy
If n increases, Z increases
One-sided or two-sided test? → based on the question context
- Look out for phrases like: (more / less/ greater than… minimum / maximum) → one-sided
-
-
**when perform hypothesis testing, answer can be on either p value or CI → either one
is fine unless stated by question to give BOTH values**
1. P value
- P < 𝛼 (tested significance level) → reject H0
- P > 𝛼 (tested significance level) → do NOT reject H0
2. CI
- Tested value is not in the CI range → reject H0
- Tested value within CI range → do NOT reject H0
Step-by-step approach to hypothesis testing question:
, 1. Analyze the question → pick out mean + standard deviation
2. Look out for command word in the question → hint to do one or two-sided test
3. WRITE DOWN THE HYPOTHESIS (H0 / HA) → MARKS WILL BE AWARDED
4. Solve for p value or CI
5. Compare and conclude
Different types of errors
Power of test
Power of decision → 1 - β
- Increase power by increasing n → decrease type II error
One-sided test
Two-sided test
What is the difference between population and sample?
Population
• Parameters: Variables (numbers), which characterize the properties of the population in Greek letters
o μ (mu) = mean of a property of the population;
o σ (sigma) = standard deviation of a property of the population
Sample
• Why is sample important?
o subset of the population used to draw conclusions about the entire population.
• Parameters are called statistics
o Sample: X (mean) and s (standard deviation)
• One sample is a limited number of elements from one population.
Data types
• Categorical data:
o what is categorical data?
Data which is qualitative (no numbers) by nature
o Kinds
Nominal ( )اسمىscale
classification only , no ranking
o E.g. Blood groups (A, B, AB, O)
Ordinal ( )ترتيبيscale
classification and rank orderapple
• Numerical data:
o What is numerical data?
(Continuous, quantitative); measurement with numbers
o Kinds
Interval scale
measurement with fixed unit; null point is arbitrarily chosen
o E.g. temperature in Celsius or Fahrenheit or Kelvin
Ratio scale
fixed unit; fixed null point
o 200 km/h is twice as fast as 100 km/h
Censored data
Other things
What is the difference between probability distribution and frequency distribution?
• Red line represent the population no uncertainty here
• Blue bars represent the sample there is a degree of uncertainty
,Additional information
The mode is the most frequent value
The median is the middle value.
The mean is the sum of all figures divided by the number of figures.
Which-test-for-what-question troubleshoot
1. Read and analyze the question FIRST!
2. See which type of data is given → is it frequency/ scale data?
3. Are the values NORMAL or NON-PARAMETRIC (will be stated if non-parametric) → if not
stated, assume normal (sample size is large enough → CLT)
4. If normal, proceed with t- test → check if data are paired (related) or independent
5. If independent → check if t-test condition is MET → F test needs to be valid then can
proceed
**in case of F test fail, data is considered to be non-parametric**
NB: please always start the question with Null/Alternative Hypothesis (mark will be awarded)
,
,Lecture 2
Tips to approach probability question:
1. Analyze the given variables 🡪 let A be the first event… / B be the second event…
2. Write down the info known in numerical value 🡪 convert from %
3. Understand problem given in probability notation 🡪 conditional probability phrase indication: “of this sample [outcome
A], [probability] has also [outcome B]….
4. Use appropriate equation given
Independent probabilities
Dependent probabilities
Parametric and non-parametric distribution
What is the difference between parametric and non-parametric distribution?
o Parametric statistical analysis: Assumption ( )افتراضthat observations in a sample originate from
population
o Non-parametric: No assumption about the underlying distribution is necessary
,Probability distribution with discrete (fixed) outcomes
Uniform probability
equal and unbiased probability for a particular event
Binomial probability
Categorical data with 2 properties/characteristics A and B; dichotomy
Basic
Parameters
Proportion 𝝅 (pi): Each object has the probability 𝜋 to have property A and the probability (1 − 𝜋) to have
property B
Sample size: 𝑛 objects which belong to groups A or B
The probability to have precisely 𝑥 objects with property A is
Steps to answer the question
1. Based on the question you determine how to solve it?
a. Normally they ask about what the event’s probability in which X is larger smaller than a specific number
i. E.g. what is the probability that pations does not have money to pay there treatment
b. Therefore: you have to calculate the probability one by one
c. Sum the probabilities up
d. 1-the sum of probabilities
Poisson distribution
Random (rare) events occurring incidentally in fixed time or space
Basic
Parameters
Average number of events per time or space =
𝑥 events occur per time- or space-unit
,Lecture 3
Steps to approach a typical normal distribution question
1. Analyze the question first → find out what is μ∧σ given in the qn
2. Express the data in the form of X N ( μ , σ 2 )
3. Perform standardization (see formula below)
4. Check Z value in 2a (one-sided) or 2b (two-sided) → based on what is asked
5. Do interpolation (if needed) → give corresponding p value
Normal distribution
Standardization
Role
( X −μ)
o Z=
σ
X = given value
If given data set is not normally distributed → possible to approximate to normal distribution
when n (sample size) > 30
,Difference between 2 sample means
,Lecture 4
Confidence interval
Confidence interval
Hypothesis testing
H0 → usually it is a commonly accepted / taken to be true statement in the context of the question
H1 → alternative hypothesis → contentious claim that we want to prove the accuracy
If n increases, Z increases
One-sided or two-sided test? → based on the question context
- Look out for phrases like: (more / less/ greater than… minimum / maximum) → one-sided
-
-
**when perform hypothesis testing, answer can be on either p value or CI → either one
is fine unless stated by question to give BOTH values**
1. P value
- P < 𝛼 (tested significance level) → reject H0
- P > 𝛼 (tested significance level) → do NOT reject H0
2. CI
- Tested value is not in the CI range → reject H0
- Tested value within CI range → do NOT reject H0
Step-by-step approach to hypothesis testing question:
, 1. Analyze the question → pick out mean + standard deviation
2. Look out for command word in the question → hint to do one or two-sided test
3. WRITE DOWN THE HYPOTHESIS (H0 / HA) → MARKS WILL BE AWARDED
4. Solve for p value or CI
5. Compare and conclude
Different types of errors
Power of test
Power of decision → 1 - β
- Increase power by increasing n → decrease type II error
One-sided test
Two-sided test