4.4C Applied Multivariate Data Analysis Lectures Summary
173 keer bekeken 17 keer verkocht
Vak
Applied Multivariate Data Analysis (FSWPEM040)
Instelling
Erasmus Universiteit Rotterdam (EUR)
Boek
Discovering Statistics Using IBM SPSS
This is a complete summary of all the lectures from the Applied Multivariate Data Analysis course in English. I got an 8.7 on the exam by using it! It includes diagrams and supplemental information from the book to improve understanding of the concepts (Regression, ANOVA, ANCOVA, etc.). The summary...
deze duidelijke verslag helpt je om te slagen voor je examen
Samenvatting Discovering Statistics Using IBM SPSS Statistics Field SPSS - Multivariate Data Analysis
Alles voor dit studieboek (314)
Geschreven voor
Erasmus Universiteit Rotterdam (EUR)
Psychologie
Applied Multivariate Data Analysis (FSWPEM040)
Alle documenten voor dit vak (9)
Verkoper
Volgen
imanshadid
Voorbeeld van de inhoud
4.4C: Applied Multivariate Data Analysis
Lecture 1: Field Chapter 2
Statistical Models
• Models → parameters + variables
• Parameters are estimated from the data and represent constant relations between
variables in the model
- Compute model parameters in the sample to estimate the value in the population
• e.g. linear regression → slope and intercept are the parameters
Model Fit
• Mean is a model of what happens in the real world: the typical score
- Not a perfect representation of the data
Calculating the Error
• The mean is the value from which the (squared) scores deviate the least (least error)
• Sum of squared errors, mean squared error/variance, standard deviation →
summarise how well the mean represents the sample data
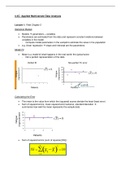
• Sum of squared errors (sum of squares [SS]):
,Mean Squared Error
• Total dispersion depends on sample size → more informative to compute average
dispersion
- Mean of the squared errors (MSE) → closer to the mean is a better fit
- The larger the SS than MSE, the worse the fit
• ‘Average’ by dividing by the degrees of freedom (N – 1)
- Because sample data is used to estimate the model fit in the population
• Less overlap of confidence intervals = bigger difference
- If overlap more than half then means are not significantly different
Mean as a Model: Variance as Simple Measure of Model Fit
• General principle of model fit: sum (SSE) or average (MSE) the squared
deviations from the model
- Larger values indicate a lack of fit
• When the model is the mean, the MSE is called variance
- Mean squared error is the same as variance
• The square root of variance (s2) is called the standard deviation (s)
- Average deviation from the mean, not in squared units but in the original units
Standard Deviation and Shape of a Sample Distribution
, • Normal distribution occurs in nature → if you have many independent units of
information
• t-value that is about 2 → will be almost significant
• t-value that is about 3 or 4 → will be very significant
From Sample to Population
• Mean (X̄) and SD (s) are obtained from a sample, but used to estimate the mean (µ)
and SD (σ) of the population
• Sampling distribution → how the parameter of interest differs across the repeated
process of sampling from the distribution (distribution of sample means)
- Average discrepancy between the means estimated from the samples is the
variability of the sampling distribution
➔ It will have a width but as you go higher, the more infrequent that value will
get because more likely to be in middle of the distribution
▪ p-value is based on this
• One sample will provide an estimate of the true population parameter
- Depending on the variability AND sample size this estimate will be more or less
precise
• SD of the means of all possible samples of size N from the population → Standard
Error (SE) of the mean
Standard Error of the Mean
• Central limit theorem → for sample size ≥ 30, the sampling distribution of sample
means is a normal distribution with mean µσ and standard deviation σX̄
• σX̄ estimated from the sample by:
- s = sample SD
- SE → on average how much sample mean will differ from population mean
• The larger N:
- The smaller SE
- The more the sample mean is representative of the population mean (the more
precise the estimate)
• Can use the SE to calculate boundaries within is believed the population mean will lie
, Standard Error and Confidence Intervals
• 95% CI: for 95% of all possible samples the population mean will be within its limits
- In 5% of cases the estimate will be wrong
- 95% of data = 2 standard deviations above and below the mean
• 95% CI calculated by assuming the t-distribution as representative of the sampling
distribution
- t-distribution looks like the standard normal distribution, but fatter tails depending
on the df
• Lower limit of CI → X̄ − (𝑡𝑛−1 × SE)
• Upper limit of CI → X̄ + (𝑡𝑛−1 × SE)
- n – 1 are the degrees of freedom
- 𝑡𝑛−1 × SE is called the margin of error
Reporting and Interpreting CIs
• 95% corresponds to α = .05
- 90% and 99% CIs can also be used
• APA: M = 8.0; 95% CI [6.0, 10.0]
Voordelen van het kopen van samenvattingen bij Stuvia op een rij:
√ Verzekerd van kwaliteit door reviews
Stuvia-klanten hebben meer dan 700.000 samenvattingen beoordeeld. Zo weet je zeker dat je de beste documenten koopt!
Snel en makkelijk kopen
Je betaalt supersnel en eenmalig met iDeal, Bancontact of creditcard voor de samenvatting. Zonder lidmaatschap.
Focus op de essentie
Samenvattingen worden geschreven voor en door anderen. Daarom zijn de samenvattingen altijd betrouwbaar en actueel. Zo kom je snel tot de kern!
Veelgestelde vragen
Wat krijg ik als ik dit document koop?
Je krijgt een PDF, die direct beschikbaar is na je aankoop. Het gekochte document is altijd, overal en oneindig toegankelijk via je profiel.
Tevredenheidsgarantie: hoe werkt dat?
Onze tevredenheidsgarantie zorgt ervoor dat je altijd een studiedocument vindt dat goed bij je past. Je vult een formulier in en onze klantenservice regelt de rest.
Van wie koop ik deze samenvatting?
Stuvia is een marktplaats, je koop dit document dus niet van ons, maar van verkoper imanshadid. Stuvia faciliteert de betaling aan de verkoper.
Zit ik meteen vast aan een abonnement?
Nee, je koopt alleen deze samenvatting voor €6,48. Je zit daarna nergens aan vast.