2AMI10
FOUNDATIONS OF PROCESS MINING
SUMMARY OF LECTURES
CONTENTS
Part 0: Introduction .......................................................................................................................................... 2
Part 1: Data preparation ................................................................................................................................... 3
Part 2: Modeling Petri nets ............................................................................................................................... 3
Part 3: Petri net properties ............................................................................................................................... 6
Part 4: Process discovery .................................................................................................................................. 9
Part 5: Language based regions ...................................................................................................................... 13
Part 6: Conformance checking ........................................................................................................................ 16
Part 7: Process Model Quality ......................................................................................................................... 17
,PART 0: INTRODUCTION
Foundations of process mining
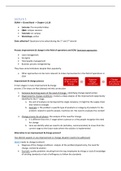
Three elements of processes:
- The process: this is how we can do things, but we do not; interpreting process mining results in the
context of a larger, overarching reality (where people are not point-masses in a vacuum)
- The data: inexplicable graphs and process reports; pre-processing data for process mining
- The model: why are our rules so complex; formal modelling of processes (using Petri nets); discovery
of process models
In the middle: ‘happy flow’; we think this is how we work – this is how it works in an ideal world, where all
people, animals, and other objects are point-masses in a vacuum
- Process and data meet: if we cannot do thinks the way we should, we do them the way we can.
- Process and model meet: this is how we should do things, but we do not.
- Model and data meet: exceptions prove the rules
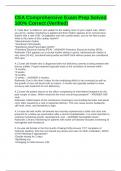
Process mining: to gain insights into processes through systematic analysis and interpretation of data. Does exist
of: Process discovery; Conformance checking; Enhancement
- Process models describe how the information is received and how the system should react; so they
analyze the world and specify configurations of the software system.
- Process discovery: using event data discover how the process of the software is behaving
- Conformance: check whether the users of the system do the same as the software system describes
Process mining activities
2|P a g e
, PART 1: DATA PREPARATION
Data preparation: the first step in any data-science activity is to prepare the data.
Basic event data: case ID, activity name, timestamp, resource, other data (e.g., product, quantity)
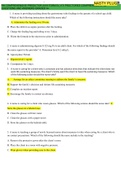
Dotted chart: a powerful tool; data can be explored and hypothesis can be formed (always verify hypothesis
with the process owner)
- Each dot in the dotted chart represent one event
- Provides a helicopter view of all events
- Using filtering in combination with the dotted chart, views on the data are created (i.e., using visual
analytics, patterns are sought in the data)
- Exporting the view to a new event log allows for further analysis on the filtered event log
- Data understanding using a dotted chart:
o (1) Collect initial data
o (2) Describe the data
o (3) Explore the data
o (4) Verify the quality
- X-axis, Y-axis, colors and shapes are all based on one single (different) attribute
- Intensity of events shown below
- Gaps in the chart could indicate (zoom in to have a better view)
o Resources that are unavailable
o Single point of failure scenario’s
o Apparently nothing could happen for a while in a company
- If there is a straight line from the top left to the right bottom, this suggests that the rate of events (of a
particular color) is rather constant
o However this line might also be waving (than it might be assumed that the speed at which
cases are arriving is varying)
o If there is an increasing negative slope, it suggest that the arrival rate is increasing
- If there is a vertical line, the dotted chart indicate batch processing
- Important notes about dotted charts from lectures
o Take settings for time into account (actual/absolute time versus relative time)
o Each line might be a particular case
o Each line might be a activity (color depending on activity, or color depending on resource)
o Each line might be a resource (color might be an activity)
PART 2: MODELING PETRI NETS
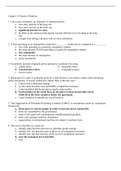
Process modeling
- Models provide an abstraction of reality such that this reality can be analyzed or reasoned about in a
consistent way
- Any time two or more activities are performed in the context of a case, fundamental principles of
processes apply (e.g., Petri net theory)
o Activities in processes are related; they have a logical order in which they are executed
o Cases are the ‘objects’ in a process that change over time
- Many systems can be modelled the same way
- System models versus Process models
3|P a g e
FOUNDATIONS OF PROCESS MINING
SUMMARY OF LECTURES
CONTENTS
Part 0: Introduction .......................................................................................................................................... 2
Part 1: Data preparation ................................................................................................................................... 3
Part 2: Modeling Petri nets ............................................................................................................................... 3
Part 3: Petri net properties ............................................................................................................................... 6
Part 4: Process discovery .................................................................................................................................. 9
Part 5: Language based regions ...................................................................................................................... 13
Part 6: Conformance checking ........................................................................................................................ 16
Part 7: Process Model Quality ......................................................................................................................... 17
,PART 0: INTRODUCTION
Foundations of process mining
Three elements of processes:
- The process: this is how we can do things, but we do not; interpreting process mining results in the
context of a larger, overarching reality (where people are not point-masses in a vacuum)
- The data: inexplicable graphs and process reports; pre-processing data for process mining
- The model: why are our rules so complex; formal modelling of processes (using Petri nets); discovery
of process models
In the middle: ‘happy flow’; we think this is how we work – this is how it works in an ideal world, where all
people, animals, and other objects are point-masses in a vacuum
- Process and data meet: if we cannot do thinks the way we should, we do them the way we can.
- Process and model meet: this is how we should do things, but we do not.
- Model and data meet: exceptions prove the rules
Process mining: to gain insights into processes through systematic analysis and interpretation of data. Does exist
of: Process discovery; Conformance checking; Enhancement
- Process models describe how the information is received and how the system should react; so they
analyze the world and specify configurations of the software system.
- Process discovery: using event data discover how the process of the software is behaving
- Conformance: check whether the users of the system do the same as the software system describes
Process mining activities
2|P a g e
, PART 1: DATA PREPARATION
Data preparation: the first step in any data-science activity is to prepare the data.
Basic event data: case ID, activity name, timestamp, resource, other data (e.g., product, quantity)
Dotted chart: a powerful tool; data can be explored and hypothesis can be formed (always verify hypothesis
with the process owner)
- Each dot in the dotted chart represent one event
- Provides a helicopter view of all events
- Using filtering in combination with the dotted chart, views on the data are created (i.e., using visual
analytics, patterns are sought in the data)
- Exporting the view to a new event log allows for further analysis on the filtered event log
- Data understanding using a dotted chart:
o (1) Collect initial data
o (2) Describe the data
o (3) Explore the data
o (4) Verify the quality
- X-axis, Y-axis, colors and shapes are all based on one single (different) attribute
- Intensity of events shown below
- Gaps in the chart could indicate (zoom in to have a better view)
o Resources that are unavailable
o Single point of failure scenario’s
o Apparently nothing could happen for a while in a company
- If there is a straight line from the top left to the right bottom, this suggests that the rate of events (of a
particular color) is rather constant
o However this line might also be waving (than it might be assumed that the speed at which
cases are arriving is varying)
o If there is an increasing negative slope, it suggest that the arrival rate is increasing
- If there is a vertical line, the dotted chart indicate batch processing
- Important notes about dotted charts from lectures
o Take settings for time into account (actual/absolute time versus relative time)
o Each line might be a particular case
o Each line might be a activity (color depending on activity, or color depending on resource)
o Each line might be a resource (color might be an activity)
PART 2: MODELING PETRI NETS
Process modeling
- Models provide an abstraction of reality such that this reality can be analyzed or reasoned about in a
consistent way
- Any time two or more activities are performed in the context of a case, fundamental principles of
processes apply (e.g., Petri net theory)
o Activities in processes are related; they have a logical order in which they are executed
o Cases are the ‘objects’ in a process that change over time
- Many systems can be modelled the same way
- System models versus Process models
3|P a g e