Applied Microeconometrics
Week 1 – Lecture 1– Introduction
Goals
- The motivation for using linear regression model
- The relationship between ceteris paribus relationship and one of the main assumptions in
linear regression models (zero conditional mean assumption)
Empirical analysis
- Use data
o Test a theory
o Estimate relationship between variables
Declaration of the dependent variable Y regarding the independent variables
X1- Xp
- First step is to clearly define your research question
o Economic model
o Intuitive and less formal reasoning
Observation and existing scientific evidence
Simple regression model
- We have two variables, y and x
o We are interested in ‘explaining y in terms of x’ or ‘how varies y with change in x’
o Y is the dependent variable
o X is the independent variable
o U is residu/ error
o B0 is the intercept with y-axe
o B1 is the slope (richtings coefficient) = dy/
dx
Example: house prices and average income
in a neighborhood
- Neighborhoods with higher income> higher average
house price> positive association
- Aim of the lineair model is to find a perfect line that can
best predict the research question
- Example error term: all other factors that affect y, but
that you don’t have in your data set
- B1 = our slope, tells us when the income
increases/changes how does the average house price
changes
Ceteris paribus relationship
- Ceteris paribus = other factors held fixed = u
,Zero conditional mean assumption
- The unobserved does not change when x changes in terms of
expected values.
- U to x is the same as u, because u does not change = 0
- It helps to
Can we draw ceteris paribus conclusions about how x affects y in our example?
- We need to assume that E(u|x)= E(u)=0 > the zero conditional mean assumption
- For the example: Assume u is the same as amenities
- Then, amenities are the same regardless of average income
o E(amenities| income=10,000) = E(amenities| income=100,000)
o If we think that the amount and quality of amenities is different in richer than in
poorer neighborhoods, then previous assumption does not hold
o We cannot observe u, so we have no way of knowing whether amenities are the
same for all levels of X
o Use research, models
,Lecture 2 – Estimation and interpretation
Goals
- To estimate the values for the intercept and the slope in a linear regression model
- To interpret quantitative explanatory variables
- Multiple regression model
How can we estimate?
- Select a random sample of the population of interest
- Residual > as small as possible
o Minimalize differences between estimated and actual value of y.
o Kwadrateren om minnen weg te werken
Stata
- You will not be asked to obtain B0 and B1 by hand, but in stata
- Interpretation: when the average income in the neighborhood increases by 1000 euros, the
average house price in the neighborhood increases by 16.000 euros, ceteris paribus
- The output tells us that the expected house price is equal to -96.000 when the average
income in the neighborhood is equal to 0
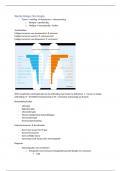
, Fitted line
Multiple regression model
- More variables
- Difficult to draw ceteris paribus conclusions using simple regression analysis
o Is density related to income? It’s not: ceteris paribus
o It is: then the zero assumption model does not apply
- Multiple regression model:
- Multiple regression analysis allows u to control for many
other factors that simultaneously affect the dependent variable
o Better predictions also
Week 1 – Lecture 1– Introduction
Goals
- The motivation for using linear regression model
- The relationship between ceteris paribus relationship and one of the main assumptions in
linear regression models (zero conditional mean assumption)
Empirical analysis
- Use data
o Test a theory
o Estimate relationship between variables
Declaration of the dependent variable Y regarding the independent variables
X1- Xp
- First step is to clearly define your research question
o Economic model
o Intuitive and less formal reasoning
Observation and existing scientific evidence
Simple regression model
- We have two variables, y and x
o We are interested in ‘explaining y in terms of x’ or ‘how varies y with change in x’
o Y is the dependent variable
o X is the independent variable
o U is residu/ error
o B0 is the intercept with y-axe
o B1 is the slope (richtings coefficient) = dy/
dx
Example: house prices and average income
in a neighborhood
- Neighborhoods with higher income> higher average
house price> positive association
- Aim of the lineair model is to find a perfect line that can
best predict the research question
- Example error term: all other factors that affect y, but
that you don’t have in your data set
- B1 = our slope, tells us when the income
increases/changes how does the average house price
changes
Ceteris paribus relationship
- Ceteris paribus = other factors held fixed = u
,Zero conditional mean assumption
- The unobserved does not change when x changes in terms of
expected values.
- U to x is the same as u, because u does not change = 0
- It helps to
Can we draw ceteris paribus conclusions about how x affects y in our example?
- We need to assume that E(u|x)= E(u)=0 > the zero conditional mean assumption
- For the example: Assume u is the same as amenities
- Then, amenities are the same regardless of average income
o E(amenities| income=10,000) = E(amenities| income=100,000)
o If we think that the amount and quality of amenities is different in richer than in
poorer neighborhoods, then previous assumption does not hold
o We cannot observe u, so we have no way of knowing whether amenities are the
same for all levels of X
o Use research, models
,Lecture 2 – Estimation and interpretation
Goals
- To estimate the values for the intercept and the slope in a linear regression model
- To interpret quantitative explanatory variables
- Multiple regression model
How can we estimate?
- Select a random sample of the population of interest
- Residual > as small as possible
o Minimalize differences between estimated and actual value of y.
o Kwadrateren om minnen weg te werken
Stata
- You will not be asked to obtain B0 and B1 by hand, but in stata
- Interpretation: when the average income in the neighborhood increases by 1000 euros, the
average house price in the neighborhood increases by 16.000 euros, ceteris paribus
- The output tells us that the expected house price is equal to -96.000 when the average
income in the neighborhood is equal to 0
, Fitted line
Multiple regression model
- More variables
- Difficult to draw ceteris paribus conclusions using simple regression analysis
o Is density related to income? It’s not: ceteris paribus
o It is: then the zero assumption model does not apply
- Multiple regression model:
- Multiple regression analysis allows u to control for many
other factors that simultaneously affect the dependent variable
o Better predictions also