Score 21/24
You passed this Milestone
21 questions were answered correctly.
UNIT 5 — MILESTONE 5
3 questions were answered incorrectly.
1
What value of z* should be used to construct a 97% confidence interval of a population mean? Answer
choices are rounded to the thousandths place.
, 1.65
1.88
1.96
2.17
RATIONALE
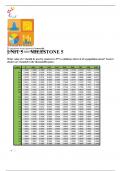
Using the z-chart to construct a 97% CI, this means that there is
1.5% for each tail. The lower tail would be at 0.015 and the upper tail would be at (1 - 0.015) or 0.985. The
value of 0.9850 is actually on the z-table exactly.
0.9850 corresponds with a z-score of 2.17.
CONCEPT
Confidence Intervals
2
George measured the weight of a random sample of 49 cartons of apples. The mean weight was 45.5 pounds,
with a standard deviation of 3.
To see if the cartons have a significantly different mean weight from 46 pounds, what would the value of
the z-test statistic be? Answer choices are rounded to the hundredths place.
-1.17
-0.13
1.17
0.13
, RATIONALE
If we first note the denominator of
Then, getting the z-score we can note it is
This tells us that 45.5 is 1.17 standard deviations below the value of 46.
CONCEPT
Z-Test for Population Means
3
A ball is drawn from a bag of 26 red and 12 yellow balls. The process is repeated 50 times, replacing each ball
that is drawn.
Which of the following statements about the distributions of counts and proportions is TRUE?
The count of drawing a yellow ball is not a binomial distribution.
The count of drawing a red ball is a binomial distribution.
The distribution of the count of drawing a yellow ball from a sample size of 10 can be approximated with
a normal distribution.
The distribution of the count of drawing a red ball cannot be approximated with a normal distribution.
RATIONALE
Recall that if we look at the counts from a large population of success and failures (2 outcomes), this is called a
binomial distribution. For this to be true, success would be a red ball and failure (blue and yellow) would be
another.
CONCEPT
Distribution of Sample Proportions
4
A researcher has a table of data with 5 column variables and 4 row variables.
The value for the degrees of freedom in order to calculate the statistic is __________.

