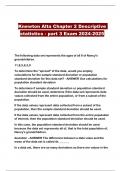
Knewton Alta Chapter 2 Descriptive statistics - part 3 Exam 2024-2025 The following data set represents the ages of all 6 of Nancy's grandchildren. 11,8,5,6,3,9 To determine the "spread" of the data, would you employ calculations for the sample standard deviation or population standard deviation for this data set? - ANSWER Use calculations for population standard deviation To determine if sample standard deviation or population standard deviation should be used, determine if the data set represents data values collected from the entire population, or from a subset of the population. If the data values represent data collected from a subset of the population, then the sample standard deviation should be used. If the data values represent data collected from the entire population of interest, then the population standard deviation should be used. In this case, the population standard deviation should be used because the data set represents all of, that is the total population of, Nancy's grandchildren. deviation - ANSWER The difference between a data value and the mean of the data set is called its _______ In a data set, there are as many deviations as there are values in the data set. deviations are used to calculate the variance and the standard deviation. Find The Variance - ANSWER In order to calculate the sample standard deviation, you must first calculate the sample variance. To calculate the sample variance, add up the squares of the deviations and then divide this sum by the quantity (n −1) where n is the number of data values in the sample. To calculate the population variance, add up the squares of the deviations and then divide this sum by the quantity N, where N is the number of data values in the population. How to find the variance - ANSWER Given the sample mean, calculate the sample variance. s2=∑(x−x¯¯¯)^2/n −1 ...where s2 = the sample variance x = the specific data value x¯¯¯ = the sample mean n = the sample size For the following dataset, you are interested to determine the "spread" of the data. Would you employ calculations for the sample standard deviation, or population standard deviation for this dataset: The pulse rate for 5 randomly selected players on a football team. - ANSWER Use calculations for sample standard deviation To determine if sample standard deviation or population standard deviation should be used, determine if the data set represents data values collected from the entire population, or from a subset of the population. If the data values represent data collected from a subset of the population, then the sample standard deviation should be used. If the data values represent data collected from the entire population of interest, then the population standard deviation should be used. In this case, the data set represents only a subset of only 5 players on a football team, so the sample standard deviation should be used. The following data set represents the pulse rate for 5 randomly selected players on a football team Find the standard deviation of the data set. Round your answer to one decimal place. 66, 70, 75, 80, 84 - ANSWER Correct answers: s= 7.3 To find the sample standard deviation, follow these steps: Find the mean of the dataset:66+70+75+80+84/5=75. Find the deviation for each data value which is calculated by taking each data value and subtracting the mean:66 −75=−9, 70−75=−5, 75−75=0, 80 −75=5, 84 −75=9 Square each of the deviations from step 2.( −92)=81, ( −52)=25, (02)=0, (52)=25, (92)=81 Add up the square of the deviations from Step 3.81+25+0+25+81=212 Divide this total from Step 4 by (n −1) which is the number of data values minus 1. 2124=53This result is the sample variance of the dataset. Take the square root of the result from Step 5. This result is then the sample standard deviation of the data set. s=53 −−√ = 7.28 Then round your answer per the rounding instructions given in the problem. The heights, in inches, of the four members of a barbershop quartet of singers are listed below. 72,68,67,73 Find the population variance for this data set. Round to one decimal place if necessary. - ANSWER Correct answers:6.5 First, we find that the mean is 72+68+67+734=2804=70 Now, we need to take the deviations from the mean and square them: ValueDeviationDeviation2722468 −2467−397339 Since there are exactly 4 members of a barbershop quartet, the 4 measurements given represent the entire population of the singing group. So we calculate the population variance. The population variance is the sum of the squared deviations, divided by the number of data values( 4). 4+4+9+9/4=6.5 The heights, in inches, of the members of a barbershop quartet of singers are listed below. 72,68,67,73 If the population variance for this data set is 6.5, what is the standard deviation of the heights of the barbershop quartet? Round your answer to 2 decimal places. - ANSWER Correct answers:2.55 The standard deviation is the square root of the variance. Since the population variance is 6.5, the (population) standard deviation is 6.5−−−√≈ 2.549 . So to two decimal places, the standard deviation is 2.55. You are told that a data set has a median of 13 and a mean of 23. Which of the following is a logical conclusion? - ANSWER The data are skewed to the right. Because the mean, 23, is greater than the median, 13, we expect that
Tentamen (uitwerkingen)
Knewton Alta Chapter 2 Descriptive statistics - part 3 Exam
Beoordeling
Verkocht
-
Pagina's
52
Cijfer
A+
Geüpload op
08-07-2024
Geschreven in
2023/2024
Knewton Alta Chapter 2 Descriptive statistics - part 3 Exam ...
Instelling
Knewton Alta
Vak
Knewton Alta
Oeps! We kunnen je document nu niet laden. Probeer het nog eens of neem contact op met support.

Geschreven voor
- Instelling
- Knewton Alta
- Vak
- Knewton Alta
Documentinformatie
- Geüpload op
- 8 juli 2024
- Aantal pagina's
- 52
- Geschreven in
- 2023/2024
- Type
- Tentamen (uitwerkingen)
- Bevat
- Vragen en antwoorden
Onderwerpen
-
knewton
-
knewton alta
-
knewton alta chapter 2
-
knewton alta chapter 2 descriptive statistics
-
the following data set represents
Voorbeeld van de inhoud
€11,53
Krijg toegang tot het volledige document:
100% tevredenheidsgarantie
Direct beschikbaar na je betaling
Lees online óf als PDF
Geen vaste maandelijkse kosten
Ook beschikbaar in voordeelbundel
Voordeelbundel
ALL KNEWTON BUNDLED EXAMS WITH ALL QUESTIONS AND VERIFIED ANSWERS 2024/2025
14
2024
€ 146,31
Meer info

