PART 1
Null hypothesis significance testing (₁NHST)
Testing your data against a null hypothesis.
The result of a null hypothesis test is a p-value.
With the same dataset different questions can be investigated
→ Description ( how many counts in each sex category? How are body heights distributed?)
→ Association (Is there a correlation between body weight and height?)
→ Difference (Are male students heavier than female? Do sexes differ in body weight?)
boxplot
Student's t-statistic
Calculates, t, the test statistic
The distribution of t depends on the degrees of freedom df (n₁+n₂ -2)
From this distribution the outcome is a p-value (a probability)
Degrees of freedom: The number of values in the final calculation of a statistic that are free to vary.
The degrees of freedom are equal to the number of independent scores that go into the estimate minus the number
of parameters used as intermediate steps in the estimation of the parameter itself.
The value of the test statistic is determined only by the experiment; So the effect size, group size (sample size n)
and variability (standard deviation s).
- Larger effect size→ larger t
- Larger sample size → larger t
- Larger variability → smaller t
≠ Two sided testing
PART 2
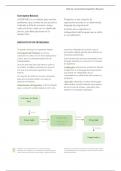
Null hypothesis
Usually, the null hypothesis is a statement of ‘no effect’ or ‘no difference’.
H₀: μA= μB
H₀: μA- μB = 0
A null hypothesis is a precise statement about a population that we try to reject with sample data.
The null hypothesis is the preposition that there is no effect or no relationship between phenomena or populations.
When rejecting the null hypothesis you are accepting the alternative hypothesis.
A null hypothesis states that there is no result ( difference, association) between two parameters (measurements)
Null hypothesis significance testing (₁NHST)
Testing your data against a null hypothesis.
The result of a null hypothesis test is a p-value.
With the same dataset different questions can be investigated
→ Description ( how many counts in each sex category? How are body heights distributed?)
→ Association (Is there a correlation between body weight and height?)
→ Difference (Are male students heavier than female? Do sexes differ in body weight?)
boxplot
Student's t-statistic
Calculates, t, the test statistic
The distribution of t depends on the degrees of freedom df (n₁+n₂ -2)
From this distribution the outcome is a p-value (a probability)
Degrees of freedom: The number of values in the final calculation of a statistic that are free to vary.
The degrees of freedom are equal to the number of independent scores that go into the estimate minus the number
of parameters used as intermediate steps in the estimation of the parameter itself.
The value of the test statistic is determined only by the experiment; So the effect size, group size (sample size n)
and variability (standard deviation s).
- Larger effect size→ larger t
- Larger sample size → larger t
- Larger variability → smaller t
≠ Two sided testing
PART 2
Null hypothesis
Usually, the null hypothesis is a statement of ‘no effect’ or ‘no difference’.
H₀: μA= μB
H₀: μA- μB = 0
A null hypothesis is a precise statement about a population that we try to reject with sample data.
The null hypothesis is the preposition that there is no effect or no relationship between phenomena or populations.
When rejecting the null hypothesis you are accepting the alternative hypothesis.
A null hypothesis states that there is no result ( difference, association) between two parameters (measurements)