SOC 200 Case Study Report 1: THREE JAYS CORPORATION (SOC 200)
University Of Arizona
All 8 results
Sort by
SOC 200 - Case Study Report 1: THREE JAYS CORPORATION Complete solution New Update 2023
University Of Arizona SOC 200 Case Study Report 1 THREE JAYS CORPORATION

-
SOC 200 - Case Study Report 1: THREE JAYS CORPORATION; Complete solution.
- Case • 12 pages • 2021
-
- $12.49
- + learn more
Case Study Report 1: THREE JAYS CORPORATION 1. Using the data in case Exhibit 4 and the 2012 annual demand, calculate the EOQ and ROP quantities for the five SKUs scheduled to be produced in the last week of June. How do these amounts compare with those calculated in 2011? Compare the increases in EOQs with the increases in annual demand. (2.5 points) The 2012 Annual Demand is given as The EOQ and ROP quantities for the five SKU’s based on 2012 annual demand is given as As Demand increased fro...

-
Study guide SOC 200 - Case Study Report 1: THREE JAYS CORPORATION; Complete solution.
- Summary • 16 pages • 2021
-
- $12.99
- + learn more
Case Study Report 1: THREE JAYS CORPORATION 1. Using the data in case Exhibit 4 and the 2012 annual demand, calculate the EOQ and ROP quantities for the five SKUs scheduled to be produced in the last week of June. How do these amounts compare with those calculated in

-
SOC 200 - Case Study Report 1: THREE JAYS CORPORATION BEST STUDY GUIDE
- Exam (elaborations) • 14 pages • 2021
-
- $12.99
- + learn more
Case Study Report 1: THREE JAYS CORPORATION 1. Using the data in case Exhibit 4 and the 2012 annual demand, calculate the EOQ and ROP quantities for the five SKUs scheduled to be produced in the last week of June. How do these amounts compare with those calculated in 2011? Compare the increases in EOQs with the increases in annual demand. (2.5 points) The 2012 Annual Demand is given as The EOQ and ROP quantities for the five SKU’s based on 2012 annual demand is given as As Demand increased fro...

-
SOC 200 - Case Study Report 1: Three Jays Corporation - Complete Study Guide Solution.
- Other • 12 pages • 2021
-
- $12.49
- + learn more
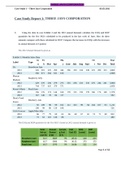
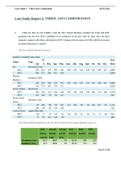
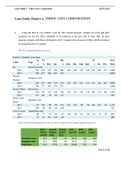
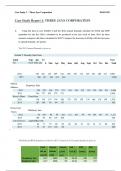
Case Study Report 1: THREE JAYS CORPORATION 1. Using the data in case Exhibit 4 and the 2012 annual demand, calculate the EOQ and ROP quantities for the five SKUs scheduled to be produced in the last week of June. How do these amounts compare with those calculated in 2011? Compare the increases in EOQs with the increases in annual demand. (2.5 points) The 2012 Annual Demand is given as Exhibit 5: Monthly Sales Data Label Type Jan Fe b Mar Apr May June July Aug Sept Oct Nov Dec Year T...

-
SOC 200 - Case Study Report 1: THREE JAYS CORPORATION
- Other • 12 pages • 2021
-
- $12.49
- + learn more
Case Study Report 1: THREE JAYS CORPORATION 1. Using the data in case Exhibit 4 and the 2012 annual demand, calculate the EOQ and ROP quantities for the five SKUs scheduled to be produced in the last week of June. How do these amounts compare with those calculated in 2011? Compare the increases in EOQs with the increases in annual demand. (2.5 points) The 2012 Annual Demand is given as The EOQ and ROP quantities for the five SKU’s based on 2012 annual demand is given as As Demand increased fro...

-
SOC 200 - Case Study Report 1: THREE JAYS CORPORATION; UPDATED
- Case • 12 pages • 2021
-
- $10.49
- + learn more
Case Study Report 1: THREE JAYS CORPORATION 1. Using the data in case Exhibit 4 and the 2012 annual demand, calculate the EOQ and ROP quantities for the five SKUs scheduled to be produced in the last week of June. How do these amounts compare with those calculated in 2011? Compare the increases in EOQs with the increases in annual demand. (2.5 points) The 2012 Annual Demand is given as The EOQ and ROP quantities for the five SKU’s based on 2012 annual demand is given as As Demand increased fro...

$6.50 for your textbook summary multiplied by 100 fellow students... Do the math: that's a lot of money! Don't be a thief of your own wallet and start uploading yours now. Discover all about earning on Stuvia


