PSY 291
Kaplan University
All 7 results
Sort by
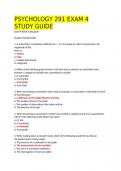
-
PSYCHOLOGY 291 EXAM 4 STUDY GUIDE
- Exam (elaborations) • 28 pages • 2024
-
- $14.49
- + learn more
PSYCHOLOGY 291 EXAM 4 STUDY GUIDE Exam 4 RDSA study guide Chapter 8 Study Guide 1. A study finds a correlation coefficient of r = .52. According to Cohen’s benchmarks, the magnitude of this effect is: a. modest. b. large. c. multiply determined. d. categorical. 2. Which of the following graph formats is the best way to examine an association claim between a categorical variable and a quantitative variable? a. A scatterplot b. A line graph c. A bar graph d. A pie chart 3. When ex...
-
PSYCHOLOGY 291 EXAM 4 STUDY GUIDE LATEST UPDATE
- Exam (elaborations) • 28 pages • 2022
-
- $13.99
- + learn more
PSYCHOLOGY 291 EXAM 4 STUDY GUIDE Exam 4 RDSA study guide Chapter 8 Study Guide 1. A study finds a correlation coefficient of r = .52. According to Cohen’s benchmarks, the magnitude of this effect is: a. modest. b. large. c. multiply determined. d. categorical. 2. Which of the following graph formats is the best way to examine an association claim between a categorical variable and a quantitative variable? a. A scatterplot b. A line graph c. A bar graph d. A pie chart 3. When ...
-
PSYCHOLOGY 291 EXAM 4 STUDY GUIDE LATEST UPDATE
- Exam (elaborations) • 28 pages • 2022
-
- $13.00
- + learn more
PSYCHOLOGY 291 EXAM 4 STUDY GUIDE Exam 4 RDSA study guide Chapter 8 Study Guide 1. A study finds a correlation coefficient of r = .52. According to Cohen’s benchmarks, the magnitude of this effect is: a. modest. b. large. c. multiply determined. d. categorical. 2. Which of the following graph formats is the best way to examine an association claim between a categorical variable and a quantitative variable? a. A scatterplot b. A line graph c. A bar graph d. A pie chart 3. When exa...
-
PSYCHOLOGY 291 EXAM 4 STUDY GUIDE | VERIFIED GUIDE
- Exam (elaborations) • 28 pages • 2022
-
- $12.94
- + learn more
PSYCHOLOGY 291 EXAM 4 STUDY GUIDE Exam 4 RDSA study guide Chapter 8 Study Guide 1. A study finds a correlation coefficient of r = .52. According to Cohen’s benchmarks, the magnitude of this effect is: a. modest. b. large. c. multiply determined. d. categorical.
-
PSYCHOLOGY 291 EXAM 4 STUDY GUIDE | VERIFIED GUIDE
- Exam (elaborations) • 28 pages • 2022
-
- $13.49
- + learn more
PSYCHOLOGY 291 EXAM 4 STUDY GUIDE Exam 4 RDSA study guide Chapter 8 Study Guide 1. A study finds a correlation coefficient of r = .52. According to Cohen’s benchmarks, the magnitude of this effect is: a. modest. b. large. c. multiply determined. d. categorical. 2. Which of the following graph formats is the best way to examine an association claim between a categorical variable and a quantitative variable? a. A scatterplot b. A line graph c. A bar graph d. A pie chart 3. When...
-
PSYCHOLOGY 291 EXAM 4 STUDY GUIDE | VERIFIED GUIDE
- Exam (elaborations) • 28 pages • 2021
-
- $13.99
- + learn more
PSYCHOLOGY 291 EXAM 4 STUDY GUIDE Exam 4 RDSA study guide Chapter 8 Study Guide 1. A study finds a correlation coefficient of r = .52. According to Cohen’s benchmarks, the magnitude of this effect is: a. modest. b. large. c. multiply determined. d. categorical. 2. Which of the following graph formats is the best way to examine an association claim between a categorical variable and a quantitative variable? a. A scatterplot b. A line graph c. A bar graph d. A pie chart 3. When exa...
-
PSYCHOLOGY 291 EXAM 4 STUDY GUIDE | VERIFIED GUIDE
- Exam (elaborations) • 28 pages • 2021
-
- $15.49
- + learn more
PSYCHOLOGY 291 EXAM 4 STUDY GUIDE Exam 4 RDSA study guide Chapter 8 Study Guide 1. A study finds a correlation coefficient of r = .52. According to Cohen’s benchmarks, the magnitude of this effect is: a. modest. b. large. c. multiply determined. d. categorical. 2. Which of the following graph formats is the best way to examine an association claim between a categorical variable and a quantitative variable? a. A scatterplot b. A line graph c. A bar graph d. A pie chart 3. When ...

Did you know that on average a seller on Stuvia earns $82 per month selling study resources? Hmm, hint, hint. Discover all about earning on Stuvia


