MATH 221 Statistics For Decision Making (MATH221)
Devry University
Pagina 3 van de 26 resultaten
Sorteer op

-
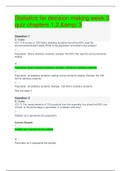
DeVry University_MATH221 | Statistics for decision making week 3 quiz chapters 1,2,& 3
- Tentamen (uitwerkingen) • 17 pagina's • 2021
- Ook in voordeelbundel
-
- $10.99
- + meer info
Statistics for decision making week 3 quiz chapters 1,2,& 3 Question 1 2 / 2 pts (CO 1) A survey of 128 DeVry statistics students found that 83% read the announcements each week. What is the population and what is the sample? Question 2 0 / 2 pts (CO 1) The measurements of 100 products from the assembly line show that 99% are correct. Is this percentage a parameter or a statistic and why? Question 3 2 / 2 pts (CO 1) Classify the data of the heights of ladders produced by a tool company. Ques...

-
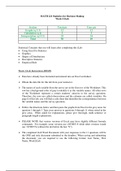
MATH 221 Statistics for Decision-Making: Week 2 | (Graded) A
- Tentamen (uitwerkingen) • 8 pagina's • 2021
- Ook in voordeelbundel
-
- $10.99
- + meer info
Creating Graphs 1. Create a pie chart for the variable Car Color: Select the column with the Car variable, including the title of Car Color. Click on Insert, and then Recommended Charts. It shoul d show a clustered column and click OK. Once the chart is shown, right click on the chart (main area) and select Change Chart Type. Select Pie and OK. Click on the pie slices, right click Add Data Labels, and select Add Data Callouts. Add an appropriate title. Copy and paste the chart here. (4 points) 2...
MATH 221 FINAL EXAM REVIEW (Version 01) MATH 221 FINAL EXAM REVIEW(Version 2)

-
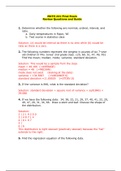
MATH 221 FINAL EXAM REVIEW (Version 01) : DEVRY UNIVERSITY
- Study guide • 5 pagina's • 2020
- Ook in voordeelbundel
-
- $20.49
- + meer info
Question: Determine whether the following are nominal, ordinal, interval, and ratio. Daily temperatures in Ripon, WI Test scores in statistics class Question: The following numbers represent the weights in pounds of six 7-year old children in Mrs. Jones’ 2nd grade class. {25, 60, 51, 47, 49, 45} Find the mean; median; mode; variance; standard deviation. Question: If the variance is 846, what is the standard deviation? Question: If we have the following data: 34, 38, 22, 21, 29, 37, 40, 41, 22,...

-
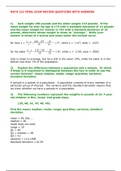
MATH 221 FINAL EXAM REVIEW(Version 2) QUESTIONS WITH ANSWERS: DEVRY UNIVERSITY
- Tentamen (uitwerkingen) • 7 pagina's • 2020
- Ook in voordeelbundel
-
- $20.49
- + meer info
MATH 221 FINAL EXAM REVIEW QUESTIONS WITH ANSWERS: DEVRY UNIVERSITY MATH 221 FINAL EXAM REVIEW QUESTIONS WITH ANSWERS: DEVRY UNIVERSITY

Die samenvatting die je net hebt gekocht, heeft iemand erg blij gemaakt. Ook wekelijks uitbetaald krijgen? Verkoop je studiedocumenten op Stuvia! Ontdek alles over verdienen op Stuvia


