2 h0 42 h1 42 - Study guides, Class notes & Summaries
Looking for the best study guides, study notes and summaries about 2 h0 42 h1 42? On this page you'll find 29 study documents about 2 h0 42 h1 42.
Page 2 out of 29 results
Sort by
-
Statistics - Portage Online Summer 2018 Module 7 Problem Set 1-5 Answers||ALL ANSWERS VERIFIED | LATEST UPDATED 2023
- Exam (elaborations) • 8 pages • 2023
- $7.99
- + learn more
Statistics - Portage Online Summer 2018 Module 7 Problem Set 1-5 Answers||ALL ANSWERS VERIFIED | LATEST UPDATED 2023
-
MATH-533 Week 6 Course Project, Part B – Hypothesis Testing and Confidence Intervals – Download For An A+
- Other • 11 pages • 2024
- $11.49
- + learn more
Running Head: Course Project Part B MATH-533 Week 6 Course Project, Part B – Hypothesis Testing and Confidence Intervals – Download For An A+ Hypothesis Testing MATH – In the hypothesis testing, two type hypotheses are made, one is called Alternate hypothesis and second is null hypothesis. What would be researched, it is called Alter hypothesis and in against of alternate hypothesis called Null hypothesis. Ans. 1 The aver...
-
COH 602 Week 2 Quiz (GRADED A) Questions and Answers. VERIFIED
- Exam (elaborations) • 16 pages • 2023
- $10.99
- + learn more
Question 1 A researcher suspects the mean trough (the lowest dosage of medication required to see clinical improvement of symptoms) level for a medication used to treat arthritis is higher than was previously reported in other studies. If previous studies found the mean trough level of the population to be 3.7 micrograms/mL, and the researcher conducts a study among 93 newly diagnosed arthritis patients and finds the mean trough to be 6.1 micrograms/mL with a standard deviation of 2.4 micrograms...
-
math practice week 8
- Exam (elaborations) • 23 pages • 2023
- $12.49
- + learn more
An urban economist is curious if the distribution in where Oregon residents live is different today than it was in 1990. She observes that today there are approximately 3,109 thousand residents in NW Oregon, 902 thousand residents in SW Oregon, 244 thousand in Central Oregon, and 102 thousand in Eastern Oregon. She knows that in 1990 the breakdown was as follows: 72.7% NW Oregon, 20.7% SW Oregon, 4.8% Central Oregon, and 2.8% Eastern Oregon. Can she conclude that the distribution in residen...

-
MATH 110 COMBINATION OF EXAM QUESTIONS & ANSWERS.
- Exam (elaborations) • 37 pages • 2023
- $13.99
- + learn more
MATH 110 COMBINATION OF EXAM ANSWERS. Exam 1 Exam Page 1 Define each of the following: a) Element. An element is described as "the individual and unique entry in a data set about which data has been collected, analyzed and presented in a same manner to differentiate" (Module 1). b) Variable. A variable is defined as a "particular measurable attribute that the researcher believes is needed to describe the element in their study" (Module 1). c) Data. Data (or the plura...

As you read this, a fellow student has made another $4.70

-
Statistics for Management and Economics 11e Keller SM TestBank
- Exam (elaborations) • 862 pages • 2022
- $15.70
- + learn more
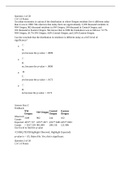
Statistics for Management and Economics 11e Keller SM Statistics for Management and Economics 11e Keller SM331 Appendix 13 A13.1 Equal-variances t-test of µ1 - µ2 H0: (µ1 - µ2) = 0 H1: (µ1 - µ2) < 0 1 2 3 4 5 6 7 8 9 10 11 12 13 14 A B C t-Test: Two-Sample Assuming Equal Variances This Year 3 Years Ago Mean 8.29 10.36 Variance 8.13 8.43 Observations 100 100 Pooled Variance 8.28 Hypothesized Mean Difference 0 df 198 t Stat -5.09 P(T<=t) one-tail 0.0000 t Cri...
-
MATH 302 week 8 tests questions & answers | AMU Latest update
- Exam (elaborations) • 76 pages • 2022
- $16.49
- 1x sold
- + learn more
MATH 302 week 8 tests questions & answers | AMU Latest update Question 1 of 20 1.0/ 1.0 Points An urban economist is curious if the distribution in where Oregon residents live is different today than it was in 1990. She observes that today there are approximately 3,109 thousand residents in NW Oregon, 902 thousand residents in SW Oregon, 244 thousand in Central Oregon, and 102 thousand in Eastern Oregon. She knows that in 1990 the breakdown was as follows: 72.7% NW Oregon, 20.7% SW Orego...

-
IOP2601 Assignment 3 (COMPLETE ANSWERS) Semester 2 2024 - DUE 25 September 2024
- Exam (elaborations) • 10 pages • 2024
- $2.50
- + learn more
QUESTION 1 [5] 1.1 Indicate whether the following statements are True or False. a) A non-directional hypothesis is used when there is no prior theoretical basis for predicting the specific direction of the effect or relationship between variables. (1) b) In a study testing a directional hypothesis, the critical region for rejecting the null hypothesis is split into two tails of the distribution. (1) c) A non-directional hypothesis always predicts that there will be no difference or relationship ...
-
STAT 301 Extra Practice EXAM QUESTIONS AND ANSWERS
- Exam (elaborations) • 12 pages • 2022
- $10.99
- + learn more
STAT 301 Extra Practice EXAM QUESTIONS AND ANSWERS 1. Which of the following represents measures of center? A. IQR, Mode, Range B. Mean, Median, Standard Deviation C. IQR, Mean, Median D. Mean, Median, Mode 2. Which of the following represents measures of spread? A. IQR, Mode, Range B. IQR, Range, Standard Deviation C. IQR, Mean, Median D. Mean, Median, Mode 3. Identify the implied population and the sample from the following situation: CNN and USA Today ran a nation...

-
TestBank for Introduction to Econometrics 3e Stock Watson SM completed Instructors Guide Completed for Exam preparation and Review
- Exam (elaborations) • 117 pages • 2022
- $20.00
- + learn more
TestBank for Introduction to Econometrics 3e Stock Watson SM For Instructors Solutions to End-of-Chapter Exercises©2011 Pearson Education, Inc. Publishing as Addison Wesley Chapter 2 Review of Probability 2.1. (a) Probability distribution function for Y Outcome (number of heads) Y 0 Y 1 Y 2 Probability 0.25 0.50 0.25 (b) Cumulative probability distribution function for Y Outcome (number of heads) Y 0 0 Y 1 1 Y 2 Y 2 Probability 0 0.25 0.75 1.0 (c) ...
