Calculate z score outlier Study guides, Class notes & Summaries
Looking for the best study guides, study notes and summaries about Calculate z score outlier? On this page you'll find 42 study documents about Calculate z score outlier.
Page 2 out of 42 results
Sort by

-
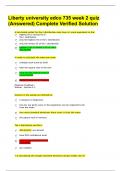
Liberty university edco 735 week 2 quiz (Answered) Complete Verified Solution
- Exam (elaborations) • 14 pages • 2023
- $10.99
- + learn more
Liberty university edco 735 week 2 quiz (Answered) Complete Verified Solution A two-tailed outlier for the t distribution must have a t score equivalent to the: highest 5% or lowest 5% of the t distribution only the highest 5% of the t distribution only the lowest 5% of the t distribution highest 2.5% or lowest 2.5% of the t distribution In order to calculate the mean you must: multiply each score by itself take the square root of the sum have at least interval level of measureme...

-
Applied Statistics From Bivariate Through Multivariate Techniques 2nd Edition Warner - Test Bank
- Exam (elaborations) • 218 pages • 2023
- $24.03
- + learn more
Chapter 3: Statistical Significance Testing Multiple Choice 1. Of the following, which is not an issue in null hypothesis significance testing logic: a. disconfirmatory evidence b. convenience sampling c. the likelihood the null hypothesis is correct d. probability of obtaining a value larger than observed Ans: c 2. Failing to reject the null hypothesis when it is true is: a. a Type I error b. a Type II error c. a correct decision d. an incorrect decision Ans: c ...
-
PRINCIPAL COMPONENT ANALYSIS (PCA) ACTUAL EXAM QUESTIONS AND ANSWERS
- Exam (elaborations) • 17 pages • 2024
- $14.49
- + learn more
What is PCA? (5 key points) Principal Component Analysis is a statistical technique used for dimensionality reduction, crucial when dealing with high-dimensional data in machine learning. It works by transforming original variables into new ones, called principal components, which are linear combinations of the original variables. Key Points: 1. Principal Components: Principal components are the directions in the data that maximize variance. The first principal component captures the most...
-
Advanced Performance Analytics CAS-PA Exam Prep ALL SOLUTION 2023/24 EDITION GUARANTEED GRADE A+
- Exam (elaborations) • 24 pages • 2023
- $14.19
- + learn more
Indicator An object which defines a specific measurement you can count or calculate to assess the process performance Breakdown A grouping of indicators scores by a qualitative attribute such as priority, category, or an assignee Widget The presentation of the indicators score formatted as a single summary value, a historical trend, or using one of many other visualization types. Dashboard A canvas containing multiple widgets that together describe a process or a service and target a spec...

-
Test Bank For Business Statistics In Practice 8th Edition By Bowerman
- Exam (elaborations) • 871 pages • 2023
- $31.59
- + learn more
Chapter 03 Test Bank - Static KEY 1. The median is the measure of central tendency that divides a population or sample into four equal parts. FALSE The median divides a population into two equal parts. AACSB: Reflective Thinking Blooms: Remember Difficulty: 1 Easy Learning Objective: 03-01 Compute and interpret the mean, median, and mode. Topic: Describing Central Tendency 2. The population mean is the average of the population measurements. TRUE AACSB: Reflective Thinking B...

Fear of missing out? Then don’t!

-
Statistics A Tool For Social Researchers in Canada 4Th Ed by Steven Prus - Test Bank
- Exam (elaborations) • 102 pages • 2023
- $25.41
- + learn more
1. What is the purpose of measures of central tendency? a. to find the most typical value of a distribution of scores b. to find the most surprising value of a distribution of scores c. to find the most significant value of a distribution of scores d. to find the most important value of a distribution of scores ANSWER: a 2. Which of these statements describes the three commonly used measures of central tendency (mode, median, and mean)? a. They define “typical” or...
-
UGBA 104 FINAL REVIEW EXAM 2023-2024 QUESTIONS AND ANSWERES WITH COMPLETE DETAILED SOLUTITIONS
- Exam (elaborations) • 6 pages • 2023
- $13.49
- + learn more
UGBA 104 FINAL REVIEW EXAM QUESTIONS AND ANSWERES WITH COMPLETE DETAILED SOLUTITIONS

-
Test Bank For Business Statistics in Practice 8Th Ed By Bruce Bowerman
- Exam (elaborations) • 871 pages • 2023
- $33.65
- + learn more
Chapter 03 Test Bank - Static KEY The median is the measure of central tendency that divides a population or sample into four equal parts. 1. FALSE The median divides a population into two equal parts. 2. The population mean is the average of the population measurements. TRUE Learning Objective: 03-01 Compute and interpret the mean, median, and mode. Topic: Describing Central Tendency AACSB: Reflective Thinking Blooms: Remember Difficulty: 1 Easy AACSB: Reflective Thinking Blooms: Re...
-
Liberty university edco 735 week 2 quiz (Answered) Complete Verified Solution
- Exam (elaborations) • 14 pages • 2023
- $10.99
- + learn more
Liberty university edco 735 week 2 quiz (Answered) Complete Verified Solution A two-tailed outlier for the t distribution must have a t score equivalent to the: highest 5% or lowest 5% of the t distribution only the highest 5% of the t distribution only the lowest 5% of the t distribution highest 2.5% or lowest 2.5% of the t distribution In order to calculate the mean you must: multiply each score by itself take the square root of the sum have at least interval level of measureme...
-
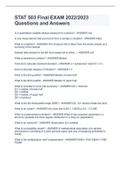
STAT 503 Final EXAM 2022/2023 Questions and Answers
- Exam (elaborations) • 4 pages • 2022
- $9.99
- 1x sold
- + learn more
Is a quantitative variable always measured in numbers? - ANSWER Yes Is any measurement that you record from a sample a variable? - ANSWER False What is a statistic? - ANSWER The measure that is taken from the whole sample as a summary of the sample Sample data skewed to the left, then longer tail is at the... - ANSWER Left What is sensitive to outliers? - ANSWER Median Formula to calculate standard deviation - ANSWER s = sqrt(sum(x1-xbar)^2 / n-1) How to calculate degrees of fr...
