Iqr q3 q1 - Study guides, Class notes & Summaries
Looking for the best study guides, study notes and summaries about Iqr q3 q1? On this page you'll find 207 study documents about Iqr q3 q1.
Page 2 out of 207 results
Sort by
-
AP Stats Exam Review - Stats Medic Questions With Complete Solutions
- Exam (elaborations) • 12 pages • 2023
- $10.49
- + learn more
How to describe a 1-variable distribution correct answer: SOCS + context Ways to describe the shape of a distribution (S) correct answer: Symmetric = balanced on both sides of the center Skewed right = tail (part with less stuff) is located to the right of the center Skewed left = tail is located to the left of the center When describing this part of a distribution, always use -ly words in your description (fairly, slightly, strongly, appropriately, etc.) Outlier Formula (3rd Qu...
-
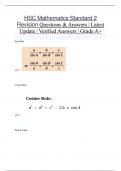
HSC Mathematics Standard 2 Revision Questions & Answers | Latest Update | Verified Answers | Grade A+
- Exam (elaborations) • 14 pages • 2024
- $11.49
- + learn more
Sine Rule :: Cosine Rule :: Future Value :: the amount of money in the future that an amount of money today will yield, given prevailing interest rates Trapezoidal rule :: Limit of reading :: smallest unit on the measuring instrument also known as precision. Absolute error :: ½ × limit of reading (maximum value) Interquartile Range (IQR) :: the difference between the first quartile and third quartile. Q3 - Q1 standard deviation :: a measure of the spread of data about the m...
-
STAT 503 FINAL EXAM QUESTIONS AND ANSWERS
- Exam (elaborations) • 4 pages • 2024
- $10.49
- + learn more
Is a quantitative variable always measured in numbers? - Answer-Yes Is any measurement that you record from a sample a variable? - Answer-False What is a statistic? - Answer-The measure that is taken from the whole sample as a summary of the sample Sample data skewed to the left, then longer tail is at the... - Answer-Left What is sensitive to outliers? - Answer-Median Formula to calculate standard deviation - Answer-s = sqrt(sum(x1-xbar)^2 / n-1) How to calculate degrees of fr...
-
AP Statistics Final Review (S1) Questions With Complete Solutions
- Exam (elaborations) • 8 pages • 2023
- $10.99
- + learn more
Is mean resistant to outliers? correct answer: No, non-resistant Is median resistant to outliers? correct answer: Yes, resistant Is standard deviation resistant to outliers? correct answer: No, non-resistant What is included in the 5-number summary? correct answer: min, Q1, med, Q3, max IQR equation correct answer: IQR = Q3 - Q1 Which point divides the area under the density curve in half? correct answer: median Which point is the balance point of the density curve? corre...
-
AP Stats Exam Review Questions And Answers With Complete Solutions
- Exam (elaborations) • 10 pages • 2023
- $10.99
- + learn more
What is needed for all Stemplots? correct answer: Key showing how to read the plot What is in the 5 number summary? correct answer: minimum, Q1, median, Q3, maximum How do you calculate IQR? correct answer: Q3-Q1 - IQR is a number, not a range What does VSCO stand for? correct answer: variability, shape, center, outliers WHAT DO YOU NEED FOR FULL POINTS? correct answer: CONTEXT "Describe the distribution" = correct answer: = VSCO + Context When describing shape without...

As you read this, a fellow student has made another $4.70

-
AP Statistics Final Exam Review 2023-2024 Questions With Complete Solutions
- Exam (elaborations) • 9 pages • 2023
- $10.99
- + learn more
Categorical Data correct answer: Assigns a unique value for each case, used to name or identify it Quantitative Data correct answer: A variable in which the numbers act as a numerical value, always have units Stem and leaf plot correct answer: Shows quantitative data values in a way that sketches the distribution of the data Ogive correct answer: a graph that represents the cumulative frequencies for the classes in a frequency distribution Histogram correct answer: Bar graphing ...
-
WGU C955 Applied Probability and Statistics Final Exam (New 2023/ 2024 Update) Questions and Verified Answers_ 100% Correct_ Graded A
- Exam (elaborations) • 38 pages • 2024
- $10.99
- + learn more
WGU C955 Applied Probability and Statistics Final Exam (New 2023/ 2024 Update) Questions and Verified Answers_ 100% Correct_ Graded A QUESTION what are the four graphical displays for quantitative data? Answer: dot plot, stem plot( or steam and leaf plot), box plot, and histogram QUESTION best to display the distribution of data, particularly clusters, gaps, and outliers. Most useful for smaller data sets Answer: dot plot QUESTION best to display the distr...
-
Straighterline Introduction to Statistics Questions and Answers Already Passed
- Exam (elaborations) • 11 pages • 2024
- $9.99
- + learn more
Straighterline Introduction to Statistics Questions and Answers Already Passed Four steps in the process of statistics 1. Producing Data 2. Exploratory Data Analysis 3. Probability 4. Inference Categorical variable places individuals into one of several groups Two types: nominal and ordinal Quantitative Variable represents a measurement or a count Two types: Interval and ratio Nominal Variable categorical variables where there is no natural order among the categories Ordinal...
-
WGU C955 - Module 4: Descriptive Statistics for a Single Variable, Top Exam Questions and answers, graded A+
- Exam (elaborations) • 17 pages • 2023
- $12.49
- 1x sold
- + learn more
WGU C955 - Module 4: Descriptive Statistics for a Single Variable, Top Exam Questions and answers, graded A+ If 200 people are surveyed, how many claim to have had no exercise? {{ Pie chart reflecting the average number of hours exercised per week. No exercise 36%, 1 - 2 hours 28%, 3 - 4 hours 12%, 4 - 5 hours 10%, 5 - 6 hours 8%, 6 - 7 hours 4%, more than 7 hours 2%. }} a 18 b 36 c 72 d Cannot determine - -72 Determine the range for the following data set. {1,24,26,28,32,36...
-
AP Stat - Chapters 1-4 - Multiple Choice - Cumulative Test 2023/2024 already passed
- Exam (elaborations) • 10 pages • 2023
- $17.99
- + learn more
AP Stat - Chapters 1-4 - Multiple Choice - Cumulative Testthe following histogram represents the distribution of acceptance rates (% accepted) among 25 business schools in 1997, what % of schools have an acceptance rate above 40% - correct answer know how to read a histogram (variable vs. freq, fraction -> %) you want to use numerical summaries to describe a distribution that is strongly skewed to the left, which combination of measure of center and spread would be the best to use (mean an...
