Math 534 week 7 - Samenvattingen en Aantekeningen
Op zoek naar een samenvatting over Math 534 week 7? Op deze pagina vind je 47 samenvattingen over Math 534 week 7.
Pagina 2 van de 47 resultaten
Sorteer op
-
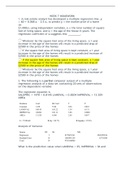
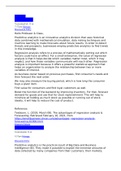
MATH 534 Week 7 Homework Problems
- Tentamen (uitwerkingen) • 5 pagina's • 2023
-
 KnowledgeBase
- $21.48
- + meer info
1. Question:Arealestateanalysthasdevelopedamultipleregressionline,y=60+0.068x1–2.5x2,topredicty=themarketpriceofahome(in $1,000s),usingindependentvariables,x1=thetotalnumberofsquare feetoflivingspace,andx2=theageofthehouseinyears.The regressioncoefficientofx2suggeststhis: _____. 2. Question:Thefollowingisapartialcomputeroutputofamultipleregressionanalysis of a data set containing 20 sets of observations on thedependentvariable. Theregressionequationis SALEPRIC=1470+0.8145LANDVAL+0.8204IMP...

-
MATH 534 Week 7 Discussion Predictive Analytics (Keller)
- Overig • 3 pagina's • 2023
-
sapling
- $14.99
- + meer info
MATH 534 Week 7 Discussion Predictive Analytics (Keller) Predictiveanalyticsisaninnovativeanalyticsdivisionthatuseshistoricaldatacombinedwith mathematical simulation, data mining techniques and machine learning to makeforecasts about future results.In order to detect threats and prospects, businessesemploy predictiveanalytics tofindtrendsin thisknowledge.
-
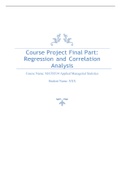
MATH 534 Week 7 Course Project Final Part C Regression and Correlation Analysis
- Overig • 4 pagina's • 2023
-
sapling
- $27.99
- + meer info
MATH 534 Week 7 Course Project Final Part C Regression and Correlation Analysis For this regression analysis we will choose X1-calls as Independent Variable and Y-Sales asDependentVariable.ThereasonbehinditisbecausethecorrelationcoefficientbetweenTimeandYearswith Salesisweakerthan Callswith Sales.

-
MATH 534 Week 7 Homework Problems
- Overig • 5 pagina's • 2023
-
AcademicGuide
- $15.49
- + meer info
1. Question:Arealestateanalysthasdevelopedamultipleregressionline,y=60+0.068x1–2.5x2,topredicty=themarketpriceofahome(in $1,000s),usingindependentvariables,x1=thetotalnumberofsquare feetoflivingspace,andx2=theageofthehouseinyears.The regressioncoefficientofx2suggeststhis: _____. 2. Question:Thefollowingisapartialcomputeroutputofamultipleregressionanalysis of a data set containing 20 sets of observations on thedependentvariable. Theregressionequationis SALEPRIC=1470+0.8145LANDVAL+0.8204IMP...

-
MATH 534 Week 7 Homework Problems
- Overig • 5 pagina's • 2023
-
AcademicResources
- $15.49
- + meer info
1. Question:Arealestateanalysthasdevelopedamultipleregressionline,y=60+0.068x1–2.5x2,topredicty=themarketpriceofahome(in $1,000s),usingindependentvariables,x1=thetotalnumberofsquare feetoflivingspace,andx2=theageofthehouseinyears.The regressioncoefficientofx2suggeststhis: _____. 2. Question:Thefollowingisapartialcomputeroutputofamultipleregressionanalysis of a data set containing 20 sets of observations on thedependentvariable. Theregressionequationis SALEPRIC=1470+0.8145LANDVAL+0.8204IMP...

Wil jij je uitgaves terugverdienen?


-
MATH 534 Week 7 Discussion; Predictive Analytics (Keller)
- Overig • 3 pagina's • 2023
-
KnowledgeBase
- $18.48
- + meer info
HelloProfessor&Class, Predictiveanalyticsisaninnovativeanalyticsdivisionthatuseshistoricaldatacombinedwith mathematical simulation, data mining techniques and machine learning to makeforecasts about future results.In order to detect threats and prospects, businessesemploy predictiveanalytics tofindtrendsin thisknowledge. Regression analysis refers to a process of mathematically sorting out which factorscouldhaveaneffect.Forasmallenterprise,thevalueofregressionanalysis isthatithelps decide whic...
-
MATH 534 Week 7 Discussion; Predictive Analytics (Keller)
- Overig • 3 pagina's • 2023
-
AcademicGuide
- $15.49
- + meer info
Predictiveanalyticsisaninnovativeanalyticsdivisionthatuseshistoricaldatacombinedwith mathematical simulation, data mining techniques and machine learning to makeforecasts about future results.In order to detect threats and prospects, businessesemploy predictiveanalytics tofindtrendsin thisknowledge. Regression analysis refers to a process of mathematically sorting out which factorscouldhaveaneffect.Forasmallenterprise,thevalueofregressionanalysis isthatithelps decide which variables matter most...

-
MATH 534 Week 7 Discussion; Predictive Analytics (Keller)
- Overig • 3 pagina's • 2023
-
AcademicResources
- $15.49
- + meer info
HelloProfessor&Class, Predictiveanalyticsisaninnovativeanalyticsdivisionthatuseshistoricaldatacombinedwith mathematical simulation, data mining techniques and machine learning to makeforecasts about future results.In order to detect threats and prospects, businessesemploy predictiveanalytics tofindtrendsin thisknowledge. Regression analysis refers to a process of mathematically sorting out which factorscouldhaveaneffect.Forasmallenterprise,thevalueofregressionanalysis isthatithelps decide whic...

-
MATH 534 Week 7 Course Project, Final Part C; Regression and Correlation Analysis
- Overig • 1 pagina's • 2023
-
AcademicResources
- $21.48
- + meer info
Final Project: Regression and Correlation Analysis Use the dependent variable (labeled Y) and one of the independent variables (labeled X1, X2, and X3) in the data file. Select and use one independent variable throughout this analysis. Use Excel to perform the regression and correlation analysis to answer the following. The week 6 spreadsheet can ... helpful in this work. 1. Generate a scatterplot for the ... dependent variable (Y) and the ... independent variable (X), including the graph of t...

-
MATH 534 Week 7 Course Project, Final Part C; Regression and Correlation Analysis
- Overig • 1 pagina's • 2023
-
AcademicGuide
- $20.48
- + meer info
Final Project: Regression and Correlation Analysis Use the dependent variable (labeled Y) and one of the independent variables (labeled X1, X2, and X3) in the data file. Select and use one independent variable throughout this analysis. Use Excel to perform the regression and correlation analysis to answer the following. The week 6 spreadsheet can ... helpful in this work. 1. Generate a scatterplot for the ... dependent variable (Y) and the ... independent variable (X), including the graph of t...
