Pie charts and bar charts - Study guides, Class notes & Summaries
Looking for the best study guides, study notes and summaries about Pie charts and bar charts? On this page you'll find 468 study documents about Pie charts and bar charts.
Page 2 out of 468 results
Sort by
-
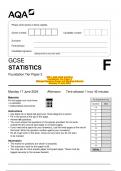
2024_AQA-GCSE Statistics Foundation Tier Paper 2 (Merged Question Paper and Marking Scheme) Monday 17 June 2024
- Exam (elaborations) • 59 pages • 2024
-
 Cate001
- $7.99
- + learn more
2024_AQA-GCSE Statistics Foundation Tier Paper 2 (Merged Question Paper and Marking Scheme) Monday 17 June 2024 Monday 17 June 2024 Afternoon Time allowed: 1 hour 45 minutes Materials For this paper you must have: • a calculator • mathematical instruments. Instructions • Use black ink or black ball-point pen. Draw diagrams in pencil. • Fill in the boxes at the top of this page. • Answer all questions. • You must answer the questions in the spaces ...
-
PL-300 Exam Questions and Answers Already Passed
- Exam (elaborations) • 199 pages • 2024
-
 BrilliantScores
- $12.99
- + learn more
PL-300 Exam Questions and Answers Already Passed How can you apply conditional formatting in Power BI? Conditional formatting in Power BI allows you to change the appearance of visuals based on specific conditions or values in the data. How can you embed a Power BI report into a website or application? Reports can be embedded into websites or applications by using Power BI's embedding APIs or generating an embed code from the Power BI Service. What are Power BI templates? Pow...
-
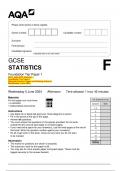
2024_AQA-GCSE Statistics – Foundation Tier Paper 1 (Merged Question Paper and Marking Scheme) Wednesday 5 June 2024
- Exam (elaborations) • 59 pages • 2024
-
Cate001
- $7.99
- + learn more
2024_AQA-GCSE Statistics – Foundation Tier Paper 1 (Merged Question Paper and Marking Scheme) Wednesday 5 June 2024 Wednesday 5 June 2024 Afternoon Time allowed: 1 hour 45 minutes Materials For this paper you must have: • a calculator • mathematical instruments. Instructions • Use black ink or black ball-point pen. Draw diagrams in pencil. • Fill in the boxes at the top of this page. • Answer all questions. • You must answer the questions...
-
MISY 5325 Excel Midterm Ultimate Review with Complete Solutions
- Exam (elaborations) • 180 pages • 2024
-
BrilliantScores
- $12.99
- + learn more
MISY 5325 Excel Midterm Ultimate Review with Complete Solutions Pressing the Ctrl key is required to select cells or ranges of cells that are not adjacent. To relocate a chart to another worksheet, users should employ the function **move chart**. If entered correctly, the functions SUMIF and DSUM will produce the same result. Which cell reference remains unchanged when formulas are copied and pasted into other cells? $A$1 (Absolute Reference) Which statement regarding the Ta...
-
Data Visualization Quiz 1 Latest Version Already Passed
- Exam (elaborations) • 13 pages • 2025
-
BrilliantScores
- $9.99
- + learn more
Data Visualization Quiz 1 Latest Version Already Passed What is the primary purpose of data visualization? To communicate data insights effectively through visual representations. Which type of chart is best suited for showing trends over time? A line chart. What is the role of color in data visualization? To highlight key differences or emphasize specific data points. How does a scatter plot help in data analysis? It shows the relationship between two variables. What is ...

Fear of missing out? Then don’t!


-
Statistics Final Exam/ 135 Qs with Definitive Solutions.
- Exam (elaborations) • 26 pages • 2025
-
 docmickey
- $9.79
- + learn more
Statistics Final Exam/ 135 Qs with Definitive Solutions. A large state university conducted a survey among their students and received 400 responses. The survey asked the students to provide the following information: *Age *Year in School (Freshman, Sophomore, Junior, Senior) *Major What type of graph would you use to describe the variable Major? - Answer: A bar chart because Major is a categorical variable. Parking at a university has become a problem. University administrators ar...
-
SAR MIS112 EXAM QUESTIONS WITH ALL CORRECT ANSWERS
- Exam (elaborations) • 17 pages • 2024
-
 Scholarsstudyguide
- $12.49
- + learn more
SAR MIS112 EXAM QUESTIONS WITH ALL CORRECT ANSWERS Which of the following is an object that contains the actual data in the chart? Plot area Pie area Bar area Column are - Answer-Plot area Fill in the blank: Every chart type has a set of ____ that you can choose from (with settings for chart elements such as a title, data labels, axes, and so on). Shapes Categories Layouts Attributes - Answer-Layouts Examine the attached workbook. If you want to remove chart label...
-
NAHQ Practice CPHQ | Questions with 100% Correct Answers | Verified | Latest Update 2024
- Exam (elaborations) • 46 pages • 2024
-
 ClassHero
- $14.49
- + learn more
1- In evaluating "long waiting times," a healthcare quality professional best demonstrates components related to staffing, methods, measures, materials, and equipment utilizing A. a run chart. B. a histogram. C. a pie chart. D. an Ishikawa diagram. - EXPLANATIONS: A. Run charts are used to track data over time. B. Histograms and bar charts are used to show distribution. C. Pie charts are used to compare parts of a whole. D. An Ishikawa (cause and effect) diagram helps to analyze p...
-
MSIS 3223 Exam 1 (Questions & Answers) Rated 100% Correct!!
- Exam (elaborations) • 11 pages • 2024
-
 ACADEMICMATERIALS
- $7.99
- + learn more
=CHOOSE(index_num, value1, value2, . . . ) - returns a value from a list based on the position in the list, specified by index_num =HLOOKUP(lookup_value,table_array,row_index_num,[range lookup]) - looks up a value in the top row of a table and returns a value in the same column from a row you specify. =INDEX(array,row_num,col_num) - returns a value or reference of the cell at the intersection of a particular row and column in a given range. =MATCH(lookup_value,lookup_array,match_type) - re...
-
MISY 5325 Excel Midterm Ultimate Review Questions And Answers With Verified Solutions
- Exam (elaborations) • 123 pages • 2024
-
 PatrickKaylian
- $7.99
- + learn more
(Excel) TRUE/FALSE: To add a pie chart, first select the data to be charted and then tap or click the Insert Pie or Doughnut Chart button (INSERT tab | Charts group). - TRUE (Excel) TRUE/FALSE: To use the AutoCalculate area, select the range of cells containing the numbers for a calculation you want to verify and then press and hold or double-click the AutoCalculate area to display the Customize Status Bar shortcut menu. - FALSE (Excel) TRUE/FALSE: The Microsoft Office Specialist (MOS) p...
