Interpreting scatterplots Study guides, Class notes & Summaries
Looking for the best study guides, study notes and summaries about Interpreting scatterplots? On this page you'll find 27 study documents about Interpreting scatterplots.
Page 3 out of 27 results
Sort by
-
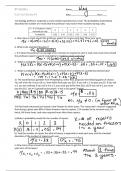
4.15-4.16 Review #1 KEY 2023
- Interview • 3 pages • 2024
- $7.99
- + learn more
AP Statistics notes delve into a comprehensive exploration of key statistical concepts, methodologies, and applications. The course begins with a solid foundation in descriptive statistics, where you learn to summarize and interpret data using measures of central tendency, dispersion, and graphical representations. This section includes discussions on histograms, box plots, and scatterplots to visually represent data patterns. Moving on to inferential statistics, your notes thoroughly cover p...
-
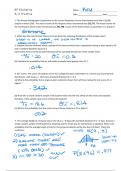
AP Statistics Practice Key
- Interview • 3 pages • 2024
- $7.99
- + learn more
AP Statistics notes delve into a comprehensive exploration of key statistical concepts, methodologies, and applications. The course begins with a solid foundation in descriptive statistics, where you learn to summarize and interpret data using measures of central tendency, dispersion, and graphical representations. This section includes discussions on histograms, box plots, and scatterplots to visually represent data patterns. Moving on to inferential statistics, your notes thoroughly cover p...
-
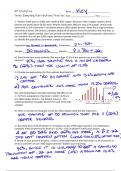
AP Statistics Practice Key
- Exam (elaborations) • 2 pages • 2024
- $7.99
- + learn more
AP Statistics notes delve into a comprehensive exploration of key statistical concepts, methodologies, and applications. The course begins with a solid foundation in descriptive statistics, where you learn to summarize and interpret data using measures of central tendency, dispersion, and graphical representations. This section includes discussions on histograms, box plots, and scatterplots to visually represent data patterns. Moving on to inferential statistics, your notes thoroughly cover p...
-
SOPHIA_UNIT_4_STATISTICS_MILESTONE_UPDATED 2022/2023 | SOPHIA_UNIT_4_STATISTICS_MILESTONE_Graded A+
- Exam (elaborations) • 6 pages • 2021
- $14.99
- 1x sold
- + learn more
UNIT 4 — MILESTONE 4 Score 17/18 You passed this Milestone 17 questions were answered correctly. 1 question was answered incorrectly. 1 This scatterplot shows the maintenance expense for a truck based on its years of service. The equation for least regression line to this data set is ŷ = 76.82x + 88.56. What is the predicted value (in dollars) for maintenance expenses when a truck is 7 years old? $626 $703 $473 $549 RATIONALE In order to get the predicted maintenance expense whe...

-
MATH 1280 Milestone 4_Introduction to Statistics (2020) | MATH1280 Milestone 4_Introduction to Statistics (2020) – ( A Grade)
- Exam (elaborations) • 21 pages • 2021
- $11.99
- + learn more
1 MATH 1280 Milestone 4_Introduction to Statistics (2020) – University of the People Which statement about correlation is FALSE? • The correlation of a data set can be positive, negative, or 0. • Correlation between the variables of the data set can be measured. • Correlation is the degree to which the two variables of a data set resemble each other. • Correlation is used to define the variables of only non-linearly related data sets. RATIONALE Recall that correlation is ...

As you read this, a fellow student has made another $4.70

-
MATH 1280 Milestone 4_Introduction to Statistics (2020) – Graded A | MATH1280 Milestone 4_Introduction to Statistics (2020) – School Graded
- Exam (elaborations) • 21 pages • 2021
- $14.99
- + learn more
1 MATH 1280 Milestone 4_Introduction to Statistics (2020) – University of the People Which statement about correlation is FALSE? • The correlation of a data set can be positive, negative, or 0. • Correlation between the variables of the data set can be measured. • Correlation is the degree to which the two variables of a data set resemble each other. • Correlation is used to define the variables of only non-linearly related data sets. RATIONALE Recall that correlation is ...
-
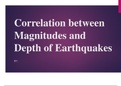
PowerPoint presentation for regression analysis (USGS)
- Exam (elaborations) • 9 pages • 2021
- $4.49
- + learn more
Scenario According to the U.S. Geological Survey (USGS), the probability of a magnitude 6.7 or greater earthquake in the Greater Bay Area is 63%, about 2 out of 3, in the next 30 years. In April 2008, scientists and engineers released a new earthquake forecast for the State of California called the Uniform California Earthquake Rupture Forecast (UCERF). As a junior analyst at the USGS, you are tasked to determine whether there is sufficient evidence to support the claim of a linear correlation b...
