Math 221 week - Study guides, Class notes & Summaries
Looking for the best study guides, study notes and summaries about Math 221 week? On this page you'll find 330 study documents about Math 221 week.
Page 3 out of 330 results
Sort by
-
DeVry University, Naperville MATH 221 Week 3 HW Quiz (answered correctly)
- Exam (elaborations) • 11 pages • 2023
-
- $9.49
- + learn more
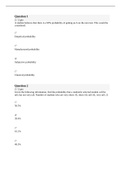
uestion 1 2 / 2 pts A student believes that there is a 90% probability of getting an A on the next test. This would be considered: Empirical probability Manufactured probability Subjective probability Classical probability Question 2 2 / 2 pts Given the following information, find the probability that a randomly selected student will be tall, but not very tall. Number of students who are very short: 45, short: 60, tall: 82, very tall: 21 50.5% 39.4% 10.1% 49.5%
-
DeVry University, Naperville MATH 221 Week 3 HW Quiz (answered correctly)
- Exam (elaborations) • 12 pages • 2023
- Available in package deal
-
- $10.49
- + learn more
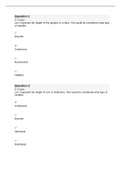
Question 1 2 / 2 pts Let x represent the height of first graders in a class. This would be considered what type of variable: Discrete Continuous Nonsensical Lagging Question 2 2 / 2 pts Let x represent the height of corn in Oklahoma. This would be considered what type of variable: Continuous Discrete Inferential Distributed IncorrectQuestion 3 0 / 2 pts Consider the following table. Age Group Frequency 18-29 9831 30-39 7845 40-49 6869 50-59 6323 60-69 5410 70 and over 52...
-
DeVry University, Naperville Math 221 Week 2 Homework...Quiz (answered correctly)
- Exam (elaborations) • 11 pages • 2023
- Available in package deal
-
- $10.49
- + learn more
Question 1 2 / 2 pts The probability of drawing one card and getting queen is 4/52. This would be considered: Subjective probability Empirical probability Manufactured probability Classical probability IncorrectQuestion 2 0 / 2 pts Given the following information, find the probability that a randomly selected student will be very tall. Number of students who are very short: 45, short: 60, tall: 82, very tall: 21 21.0% 10.1% 21.6% 49.5% Question 3 2 / 2 pts Given the following in...
-
MATH 221 Week 5 Homework well explained 2023 latest
- Exam (elaborations) • 6 pages • 2023
- Available in package deal
-
- $9.49
- + learn more
Question 1 2 / 2 pts From a random sample of 58 businesses, it is found that the mean time the owner spends on administrative issues each week is 20.53 with a standard deviation of 3.54. What is the 95% confidence interval for the amount of time spent on administrative issues? (19.24, 24.14) (16.99, 24.07) (13.45, 27.61) X (19.62, 21.44) Question 2 2 / 2 pts If a confidence interval is given from 43.85 up to 61.95 and the mean is known to be 52.90, what is the maximum error? X9...
Math 221 Quiz Week 1 to Week 7 Combined Quizzes with complete solution
MATH 221 Quiz Week 7 : DeVry University, New York - Worth 60 Points.
-
Exam (elaborations) MATH 221 Week 5 Homework well explained 2023 latest
- Exam (elaborations) • 6 pages • 2023
-
- $8.49
- + learn more
Question 1 2 / 2 pts From a random sample of 58 businesses, it is found that the mean time the owner spends on administrative issues each week is 20.53 with a standard deviation of 3.54. What is the 95% confidence interval for the amount of time spent on administrative issues? (19.24, 24.14) (16.99, 24.07) (13.45, 27.61) X (19.62, 21.44) Question 2 2 / 2 pts If a confidence interval is given from 43.85 up to 61.95 and the mean is known to be 52.90, what is the maximum error? X9...
-
DeVry University, Naperville MATH 221 Week 3 HW help questions and answers well elaborated
- Exam (elaborations) • 7 pages • 2023
- Available in package deal
-
- $9.49
- + learn more
Let x represent the number of pets in pet stores. This would be considered what type of variable: Discrete Nonsensical Lagging Continuous Flag this Question Question 22 pts Let x represent sheets of paper in a package. This would be considered what type of variable: Discrete Continuous Inferential Distributed Flag this Question Question 32 pts Consider the following table. Age Group Frequency 18-29 9831 30-39 7845 40-49 6869 50-59 6323 60-69 5410 70 and over 5279 If you c...
-
MATH 221 Quiz Week 3 (Devry university)
- Other • 12 pages • 2023
-
- $20.49
- + learn more
(CO 1) A survey of 128 DeVry statistics students found that 83% read the announcements each week. What is the population and what is the sample? Population: all statistics students reading announcements weekly; Sample: the 128 DeVry statistics students Population: DeVry statistics students; Sample: the 83% that read the announcements weekly Population: all statistics students; Sample: 128 DeVry statistics students Population: DeVry statistics students: Sample: 128 DeVry statistics st...
-
MATH 221 Week 8 Quiz (100% Correct Answers) | Download To Score An A.
- Exam (elaborations) • 25 pages • 2021
-
- $10.99
- 2x sold
- + learn more
MATH 221 Week 8 Quiz Question The table shows data collected on the relationship between the time spent studying per day and the time spent reading per day. The line of best fit for the data is y ˆ=0.16x+36.2. Assume the line of best fit is significant and there is a strong linear relationship between the variables. Studying (Minutes) Reading (Minutes) (a) According to the line of best fit, what would be the predicted number of minutes spent reading for someone who spent 67 minutes studying? ...

Did you know that on average a seller on Stuvia earns $82 per month selling study resources? Hmm, hint, hint. Discover all about earning on Stuvia

