Statistics math 221 - Study guides, Class notes & Summaries
Looking for the best study guides, study notes and summaries about Statistics math 221? On this page you'll find 150 study documents about Statistics math 221.
Page 3 out of 150 results
Sort by
-
MATH 221 FINAL STUDY-Statistics with Complete Solutions
- Exam (elaborations) • 5 pages • 2023
- $10.99
- + learn more
Difference between categorical and quantitative data - ANSWER-Quantitative variables provide numerical information. Categorical variables yield data that can only be considered as categories. Differences in the definitions of a Parameter, Population, Statistic and a Sample - ANSWER-Parameter: Numbers that summarize data from a population Population: Entire collection of a group Statistic: The probability of obtaining a result or numbers that summarize the data from a sample Sample: A man...
-
MATH 225N: Week 7 Assignment Developing Hypothesis and understanding Possible Conclusion for Proportions (Q&A) Latest Update
- Exam (elaborations) • 8 pages • 2022
- $11.49
- + learn more
MATH 225N: Week 7 Assignment Developing Hypothesis and understanding Possible Conclusion for Proportions (Q&A) Latest Update. Identify the null and alternative hypotheses for an experiment with one population proportion Question Devin is a researcher for a pharmaceutical company testing whether a new prescription pain medication causes patients to develop nausea. The medication would have to be scrapped if more than 6% of patients who take the medication develop nausea on a regular basis. ...
-
ATH221_W2_Lab_Excel_Adrian Arneson/MATH221 Statistics for Decision Making Week 2 Lab
- Exam (elaborations) • 7 pages • 2023
- $9.49
- + learn more
Week 2 Lab Instructions-BEGIN Data have already been formatted and entered into an Excel worksheet. Obtain the Lab data file (Excel) for this lab from your instructor. Use the Week 1 spreadsheet (available from Week 1: Resources) for graphs and calculations. You will need to copy data from the Lab data file into the Week 1 calculations spreadsheet to answer some of these Lab questions. The names of each variable from the survey are in the first row of the Lab data Workshee...

-
Exam (elaborations) DeVry University, Naperville MATH 221 quiz 5(Latest 2023)
- Exam (elaborations) • 19 pages • 2023
- $8.49
- + learn more
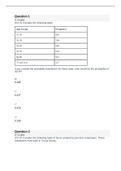
Question 1 2 / 2 pts (CO 4) Consider the following table: Age Group Frequency 18-29 983 30-39 784 40-49 686 50-59 632 60-69 541 70 and over 527 If you created the probability distribution for these data, what would be the probability of 30-39? 0.189 0.237 0.425 0.165 Question 2 2 / 2 pts (CO 4) Consider the following table of hours worked by part-time employees. These employees must work in 5 hour blocks. Weekly hours worked Probability 5 0.06 15 0.61 20 0.18 25 0.15 Fin...
-
DeVry University, Naperville MATH 221 Week 3 Quiz (answered correctly
- Exam (elaborations) • 18 pages • 2023
- $9.49
- + learn more
Question 1 0 / 2 pts (CO 1) A survey of 385 people who like wild sweaters found that 74% had a wild holiday sweater. What is the population and what is the sample? Population: people who like wild sweaters: Sample: the 385 people who had a wild holiday sweater Population: people who like sweaters; Sample: the 74% that had a wild holiday sweater Population: people who like wild sweaters; Sample: the 385 people who like wild sweaters Population: people who like wild sweaters; Sample: the ...

Fear of missing out? Then don’t!


-
DeVry University, Naperville MATH 221 Math 221 Week 7 Quiz
- Exam (elaborations) • 18 pages • 2023
- $9.49
- + learn more
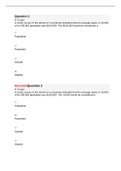
Question 1 2 / 2 pts (CO6) From a random sample of 55 businesses, it is found that the mean time that employees spend on personal issues each week is 5.8 hours with a standard deviation of 0.35 hours. What is the 95% confidence interval for the amount of time spent on personal issues? (5.74, 5.90) (5.73, 5.87) (5.72, 5.88) Correct! (5.71, 5.89) Question 2 0 / 2 pts (CO6) If a confidence interval is given from 8.54 to 10.21 and the mean is known to be 9.375, what is the maximum erro...
-
DeVry University, Naperville MATH 221 quiz (Latest 2023)
- Exam (elaborations) • 19 pages • 2023
- $11.49
- + learn more
Question 1 2 / 2 pts (CO 4) Consider the following table: Age Group Frequency 18-29 983 30-39 784 40-49 686 50-59 632 60-69 541 70 and over 527 If you created the probability distribution for these data, what would be the probability of 30-39? 0.189 0.237 0.425 0.165 Question 2 2 / 2 pts (CO 4) Consider the following table of hours worked by part-time employees. These employees must work in 5 hour blocks. Weekly hours worked Probability 5 0.06 15 0.61 20 0.18 25 0.15 Fin...
-
DeVry University, Keller Graduate School of Management_MATH 221Week 7 quiz (Latest 2022/2023)
- Exam (elaborations) • 18 pages • 2023
- $10.49
- + learn more
Question 1 2 / 2 pts (CO6) From a random sample of 55 businesses, it is found that the mean time that employees spend on personal issues each week is 5.8 hours with a standard deviation of 0.35 hours. What is the 95% confidence interval for the amount of time spent on personal issues? (5.74, 5.90) (5.73, 5.87) (5.72, 5.88) Correct! (5.71, 5.89) Question 2 0 / 2 pts (CO6) If a confidence interval is given from 8.54 to 10.21 and the mean is known to be 9.375, what is the maximum erro...
-
Math 221 Week 1 Quiz Answers help questions and answers well elaborated
- Exam (elaborations) • 12 pages • 2023
- $9.49
- + learn more
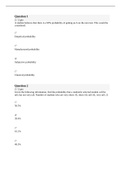
Question 1 2 / 2 pts A recent survey of the alumni of a university indicated that the average salary of 10,000 of its 200,000 graduates was $130,000. The $130,000 would be considered a: Population Parameter Sample Statistic IncorrectQuestion 2 0 / 2 pts A recent survey of the alumni of a university indicated that the average salary of 10,000 of its 200,000 graduates was $130,000. The 10,000 would be considered a: Population Parameter Sample Statistic Question 3 2 / 2 pts Based ...
-
DeVry University, Naperville MATH 221 Week 3 HW Quiz (answered correctly)
- Exam (elaborations) • 11 pages • 2023
- $9.49
- + learn more
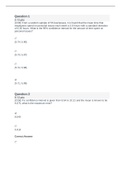
uestion 1 2 / 2 pts A student believes that there is a 90% probability of getting an A on the next test. This would be considered: Empirical probability Manufactured probability Subjective probability Classical probability Question 2 2 / 2 pts Given the following information, find the probability that a randomly selected student will be tall, but not very tall. Number of students who are very short: 45, short: 60, tall: 82, very tall: 21 50.5% 39.4% 10.1% 49.5%
