Distribution plot Study guides, Class notes & Summaries
Looking for the best study guides, study notes and summaries about Distribution plot? On this page you'll find 1400 study documents about Distribution plot.
Page 4 out of 1.400 results
Sort by
-
NURS 5366 Week 5 Nursing Research Statistics Questions and Answers 100%Accuracy, Latest 2024.
- Exam (elaborations) • 17 pages • 2024
- $10.99
- + learn more
NURS 5366 Week 5 Nursing Research Statistics Questions and Answers 100%Accuracy, Latest 2024. Chapter 3 - DESCRIPTIVE STATISTICS, PROBABILITY, AND MEASURE OF CENTRAL TENDENCY descriptive Statistics - computed to reveal characteristics of the sample and to describe study variable How to describe a sample - create a frequency distribution of the variable or variable being studied - is a plot of one variable, whereby the x-axis consists of possible values of that variable , and the y - axis...
-
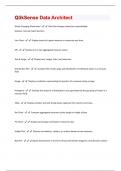
QlikSense Data Architect questions and answers all are correct graded A+
- Exam (elaborations) • 6 pages • 2024
- $7.99
- + learn more
Slowly Changing Dimensions - Data that changes slowly but unpredictably Solution: Interval match function Line Chart - Display trends of a given measure or measures over time. KPI - Display one or two aggregated measure values. Text & image - Display text, images, links, and measures. Distribution Plot - Compare the overall range and distribution of individual values in a measure field. Gauge - Display an indicator representing the position of a measure along a range. Histogram - Evaluat...
-
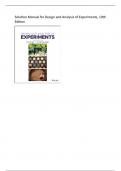
Solution Manual for Design and Analysis of Experiments, 10th Edition
- Exam (elaborations) • 710 pages • 2024
- $39.89
- 1x sold
- + learn more
Solution Manual for Design and Analysis of Experiments, 10th Edition Solutions from Montgomery, D. C. (2019) Design and Analysis of Experiments, Wiley, NY 1-1 Chapter 1 Introduction Solutions 1.1S. Suppose that you want to design an experiment to study the proportion of unpopped kernels of popcorn. Complete steps 1-3 of the guidelines for designing experiments in Section 1.4. Are there any major sources of variation that would be difficult to control? Step 1 – Recognition of and s...
-
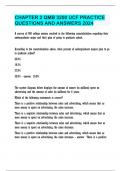
CHAPTER 2 QMB 3200 UCF PRACTICE QUESTIONS AND ANSWERS 2024
- Exam (elaborations) • 18 pages • 2024
- $14.99
- + learn more
A survey of 800 college seniors resulted in the following crosstabulation regarding their undergraduate major and their plan of going to graduate school. According to the crosstabulation above, what percent of undergraduate majors plan to go to graduate school? 65.0% 19.3% 27.8% 35.0% 35.0% The scatter diagram below displays the amount of money (in millions) spent on advertising and the amount of sales (in millions) for 8 years. Which of the following statements is correct? Ther...
-
WGU C955 MODULE 4 EXAM. DESCRIPTIVE STATISTICS FOR A SINGLE VARIABLE. QUESTIONS WITH 100% VERIFIED ANSWERS.
- Exam (elaborations) • 14 pages • 2024
- $10.49
- + learn more
48. What is the third quartile ( Q3 ) of this data set? a) 152 b) 155.5 c) 157 d) 159 49. Which of the following would be the best option to graphically display continuous data? a) Bar Chart b) Histogram c) Pie Chart d) Box Plot 50. Which of the following is defined as data that represents values that can be counted or measured? a) descriptive data b) qualitative data c) categorical data d) quantitative data 51. A data point that is significantly distant from the other ...

Want to regain your expenses?

-
GED Math Exam Questions And Answers
- Exam (elaborations) • 13 pages • 2024
- $8.99
- + learn more
GED Math Exam Questions And Answers Box plot - ANS a way of graphically depicting groups of numerical data through their quartiles consecutive numbers - ANS numbers in counting order Data - ANS a collection of facts, such as numbers, words, measurements, observations or even just descriptions of things Dot plot - ANS a graphical display of data using dots Function - ANS a special relationship where each input has a single output. It is often written as "f(x)" w...

-
NURS 5366 Week 5 Nursing Research Statistics Questions and Answers 100%Accuracy, Latest 2024.
- Exam (elaborations) • 17 pages • 2024
- $11.49
- + learn more
NURS 5366 Week 5 Nursing Research Statistics Questions and Answers 100%Accuracy, Latest 2024. Chapter 3 - DESCRIPTIVE STATISTICS, PROBABILITY, AND MEASURE OF CENTRAL TENDENCY descriptive Statistics - computed to reveal characteristics of the sample and to describe study variable How to describe a sample - create a frequency distribution of the variable or variable being studied - is a plot of one variable, whereby the x-axis consists of possible values of that variable , and the y - axis...
-
NURS 5366 week 5 Nursing Research Statistics QUESTIONS AND ANSWERS 100% Accuracy, latest Answered
- Exam (elaborations) • 16 pages • 2024
- $7.99
- + learn more
NURS 5366 week 5 Nursing Research Statistics QUESTIONS AND ANSWERS 100% Accuracy, latest Answered-Chapter 3 - DESCRIPTIVE STATISTICS, PROBABILITY, AND MEASURE OF CENTRAL TENDENCY descriptive Statistics - computed to reveal characteristics of the sample and to describe study variable How to describe a sample - create a frequency distribution of the variable or variable being studied - is a plot of one variable, whereby the x-axis consists of possible values of that variable , and the y - ...
-
LSS Final Exam Package Questions and Answers with Complete Solutions Graded A 2024
- Exam (elaborations) • 47 pages • 2024
- $14.49
- + learn more
Which of the following tools are considered part of the seven quality control (7QC) tools. a) gage R & R b) flow charts c) Pareto charts d) control charts e) b, c and d f) all the above - e) flow charts, pareto charts and control charts True or False: A cause and effect diagram captures historical knowledge but does not focus on present knowledge. - False True or False: The check sheet is one of the seven quality control tools. - True Depending on the type of control chart used, w...
-
UCF QMB 3200 - EXAM 3 CONCEPTS QUESTIONS AND ANSWERS 2024.
- Exam (elaborations) • 12 pages • 2024
- $15.99
- + learn more
residual The difference between the observed value of the dependent variable and the value predicted using the estimated regression equation is called a(n) increase the value of the correlation. Influential observations always: normal probability plot. A graph of the standardized residuals plotted against values of the normal scores that helps to determine whether the assumption that the error term has a normal probability distribution appears to be valid is called a: lin...
