Histogram skewed right - Study guides, Class notes & Summaries
Looking for the best study guides, study notes and summaries about Histogram skewed right? On this page you'll find 446 study documents about Histogram skewed right.
Page 4 out of 446 results
Sort by
-
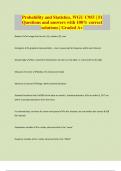
Probability and Statistics, WGU C955 | 51 Questions and answers with 100% correct solutions | Graded A+
- Exam (elaborations) • 6 pages • 2024
- $12.48
- + learn more
Boxplot an image that has min, Q1, median, Q3, max Histogram A graphical representation -- bars, measuring the frequency within each interval Skewed right Not a symmetric distribution, the tail is on the right, i.e. extra stuff on the right Measures of center Median, the mean (and mode) Measures of spread Range, IQR & standard deviation Standard Deviation Rule 68% of the data are within 1 standard deviation, 95% are within 2, 99.7 are within 3 standard deviations from the mean. For skewed...
-
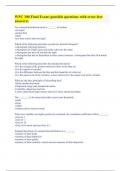
WPC 300 Final Exam (possible questions with error-free answers)
- Exam (elaborations) • 47 pages • 2023
- $17.48
- + learn more
For a normal distribution mean is _______ to median. -not equal -greater than -equal -less than correct answers equal Which of the following describes a positively skewed histogram? -a histogram with large kurtosis -a histogram for which mean and mode values are the same. -a histogram that tails off towards the right -a histogram that has no fluctuation in mass correct answers -a histogram that tails off towards the right Which of the following describes the standard deviation? -I...
-
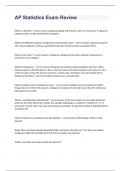
AP Statistics Exam Review 2023 verified to pass
- Exam (elaborations) • 24 pages • 2023
- $18.49
- + learn more
AP Statistics Exam ReviewWhat is a dot plot? - correct answer A graphical display which shows "dots" for each point. It's good for categorical data- ie data classified into categories. What's the difference between categorical and quantitative data? - correct answer Categorical data fits into various categories; whereas, quantitative data has numerical values associated with it. What is a bar chart? - correct answer A display for categorical data which indicates frequencies or percents...
-
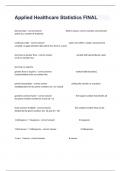
Applied Healthcare Statistics FINAL Exam With Complete Questions And Answers.
- Exam (elaborations) • 10 pages • 2024
- $12.99
- + learn more
discrete data - correct answer distinct values, can be counted, unconnected points (ex. number of students) continuous data - correct answer values are within a range, measured not counted, no gaps between data points (ex. time in a race) less than or greater than - correct answer marked with (parenthesis), open circle on number line less than or e...
-
WGU C955 - PA Exam Questions With Correct Answers
- Exam (elaborations) • 28 pages • 2024
- $11.49
- + learn more
What is 3/4 divided by 2/3? A) 9/8 B) 5/12 C) 5/7 D) 6/7 - Answer 9/8 A county park has hiking paths with lengths of 1.05, 3.6, 3.17, and 2.2 miles. What is the total length, in miles, of hiking paths in the park? A) 9.02 miles B) 10.02 miles C) 10.12 miles D) 11.2 miles - Answer 10.02 miles If there are 2 tablespoons in 1 fluid ounce, how many tablespoons does the following calculation yield? 4 fl oz - 1.5 tbsp 0.5 tbsp 1 tbsp 2.5 tbsp 6.5 tbsp - Answer 6.5 tbsp...

Fear of missing out? Then don’t!

-
Applied Healthcare Statistics FINAL Exam With Questions And 100% Verified Answers Rated A+.
- Exam (elaborations) • 10 pages • 2024
- $12.99
- + learn more
discrete data - correct answer distinct values, can be counted, unconnected points (ex. number of students) continuous data - correct answer values are within a range, measured not counted, no gaps between data points (ex. time in a race) less than or greater than - correct answer marked with (parenthesis), open circle on number line less than or equal to greater than or...
-
WGU C955 Exam Questions & Answers 100% Solved
- Exam (elaborations) • 3 pages • 2024
- $10.99
- + learn more
Histogram - Answer A graphical representation -- bars, measuring the frequency within each interval Skewed right - Answer Not a symmetric distribution, the tail is on the right Measures of center - Answer Median, the mean (and mode) Measures of spread - Answer Range, IQR & standard deviation Standard Deviation Rule - Answer 68% of the data are within 1 standard deviation, 95% are within 2, 99.7% are within 3 standard deviations from the mean. median (for center) & IQR (for spr...
-
WPC 300 FINAL EXAM| 100 Questions| With Complete Solutions
- Exam (elaborations) • 11 pages • 2023
- $10.49
- + learn more
Which of the following describes the standard deviation? correct answer: It is the square root of the variance. When two variables are highly positively correlated, the correlation coefficient will be _______. correct answer: close to 1 According to statistical notation, what does ∑ stand for? correct answer: to act as a summation operator The ________ is the observation that occurs most frequently. correct answer: mode The difference between the first and third quartiles is re...
-
Review Final Exam for WPC 300 2024/2025 questions with A-graded answers
- Exam (elaborations) • 8 pages • 2024
- $12.49
- + learn more
Review Final Exam for WPC 300 2024/2025 questions with A-graded answers Which of the following describes the standard deviation? - CORRECT ANSWER-It is the square root of the variance. When two variables are highly positively correlated, the correlation coefficient will be _______. - CORRECT ANSWER-close to 1 According to statistical notation, what does ∑ stand for? - CORRECT ANSWER-to act as a summation operator The ________ is the observation that occurs most frequently. - CORR...
-
AP Stat - Chapters 1-4 - Multiple Choice - Cumulative Test 2023/2024 already passed
- Exam (elaborations) • 10 pages • 2023
- $17.99
- + learn more
AP Stat - Chapters 1-4 - Multiple Choice - Cumulative Testthe following histogram represents the distribution of acceptance rates (% accepted) among 25 business schools in 1997, what % of schools have an acceptance rate above 40% - correct answer know how to read a histogram (variable vs. freq, fraction -> %) you want to use numerical summaries to describe a distribution that is strongly skewed to the left, which combination of measure of center and spread would be the best to use (mean an...
