Iqr q3 q1 - Study guides, Class notes & Summaries
Looking for the best study guides, study notes and summaries about Iqr q3 q1? On this page you'll find 207 study documents about Iqr q3 q1.
Page 4 out of 207 results
Sort by
-
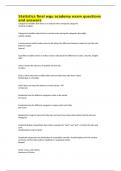
Statistics final wgu academy exam questions and answers
- Exam (elaborations) • 6 pages • 2024
- $10.00
- + learn more
Statistics final wgu academy exam questions and answers Categorical variables that there is no natural order among the categories nominal variables Categorical variables where there is natural order among the categories (low-high) ordinal variable A measurement which makes sense to talk about the difference between values but not the ratio between values interval Quantitive variables where is makes sense to talk about the difference in ratios. (Income, weight) ratio Valu...
-
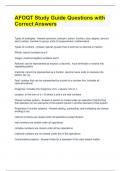
AFOQT Study Guide Questions with Correct Answers
- Exam (elaborations) • 22 pages • 2024
- $10.99
- + learn more
AFOQT Study Guide Questions with Correct Answers Types of analogies - Answer-synonym, antonym, action, function, size, degree, amount, part to whole, member to group, units of measurement, mathematical Types of numbers - Answer-natural: greater than 0 and has no decimal or fraction Whole: natural numbers and 0 Integer: positive/negative numbers and 0 Rational: can be represented as fraction or decimal , must terminate or resolve into repeating pattern Irrational: cannot be represented...
-
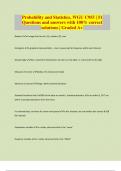
Probability and Statistics, WGU C955 | 51 Questions and answers with 100% correct solutions | Graded A+
- Exam (elaborations) • 6 pages • 2024
- $13.48
- + learn more
Boxplot an image that has min, Q1, median, Q3, max Histogram A graphical representation -- bars, measuring the frequency within each interval Skewed right Not a symmetric distribution, the tail is on the right, i.e. extra stuff on the right Measures of center Median, the mean (and mode) Measures of spread Range, IQR & standard deviation Standard Deviation Rule 68% of the data are within 1 standard deviation, 95% are within 2, 99.7 are within 3 standard deviations from the mean. For skewed...
-
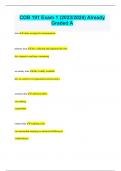
COB 191 Exam 1 (2023/2024) Already Graded A
- Exam (elaborations) • 14 pages • 2023
- $9.99
- + learn more
COB 191 Exam 1 (2023/2024) Already Graded A data values assigned to measurements primary data adv: collected and orgainzed by user dis: expensive and time consuming secondary data adv: readily available dis: no control over organization and accuracy nominal data -arbitrary labels -no ranking -name/label ordinal data -ranking exists -no measurable meaning to numerical differences -order/choices interval data -meaningful differences -no true value of zero -gives orders of values AND ability t...
-
AP Stat - Chapters 1-4 - Multiple Choice - Cumulative Test question and answers graded A+
- Exam (elaborations) • 10 pages • 2023
- $17.99
- + learn more
AP Stat - Chapters 1-4 - Multiple Choice - Cumulative Testthe following histogram represents the distribution of acceptance rates (% accepted) among 25 business schools in 1997, what % of schools have an acceptance rate above 40% - correct answer know how to read a histogram (variable vs. freq, fraction -> %) you want to use numerical summaries to describe a distribution that is strongly skewed to the left, which combination of measure of center and spread would be the best to use (mean an...

As you read this, a fellow student has made another $4.70


-
Probability and Statistics, WGU C955 | 51 Questions and answers with 100% correct solutions | Graded A+
- Exam (elaborations) • 6 pages • 2024
- $12.48
- + learn more
Boxplot an image that has min, Q1, median, Q3, max Histogram A graphical representation -- bars, measuring the frequency within each interval Skewed right Not a symmetric distribution, the tail is on the right, i.e. extra stuff on the right Measures of center Median, the mean (and mode) Measures of spread Range, IQR & standard deviation Standard Deviation Rule 68% of the data are within 1 standard deviation, 95% are within 2, 99.7 are within 3 standard deviations from the mean. For skewed...
-
Stat 500 MIDTERM EXAM QUESTIONS AND CORRECT ANSWERS 2023.
- Exam (elaborations) • 6 pages • 2023
- $10.49
- + learn more
Stat 500 MIDTERM EXAM QUESTIONS AND CORRECT ANSWERS 2023. Name:_ SOLUTIONS (8 questions) YOU HAVE 3 HOURS TO COMPLETE THIS. Show all work. Just showing answer without calculations may result in a zero for that question. 1. A water-heater manufacturer guarantees the electric heating element for a period of five years. The lifetimes, in months, for a sample of 10 such elements are as follows. 49.3 79.3 186.4 68.4 62.6 65.1 53.2 32.3 40.1 29.3 A. (10 points) Using the methods we learned ...
-
UGBA 104 M1 2023 Correct Questions & Answers(Rated A+)
- Exam (elaborations) • 4 pages • 2023
- $10.99
- + learn more
calculate outliers IQR method - ANSWER IQR below; Q1 - 1.5 * IQR IQR above; Q3 + 1.5 * IQR how to calculate percentiles - ANSWER percentile (L) = (n+1) * P/100 calculate z score outlier - ANSWER (value-mean)/SD rule of thumb for z score outlier - ANSWER above or below 3 SDs away which outlier method is more lenient - ANSWER z score, it goes further from mean than the IQR method ie the IQR gives a z score less than 3 cross tabulation - ANSWER a table or matrix that shows the rela...
-
WGU Statistics Questions and Answers Already Passed
- Exam (elaborations) • 15 pages • 2023
- $9.99
- + learn more
WGU Statistics Questions and Answers Already Passed The probability of any event is between one and o. What is the equation for this? For any event A, 0 ≤ P(A) ≤ 1. The sum of all possible probabilities is___? One, the equation is :P(S) = 1 What is the complement rule? or the probability that an event does not occur is 1 minus the probability that it does occur. P(not A) = 1 - P(A) In probability, "OR" means either one or the other or both. P(A or B) = P(event A occurs or event B occurs...
-
Statistics Exam Questions With 100% Correct Answers
- Exam (elaborations) • 1 pages • 2024
- $8.49
- + learn more
Statistics Exam Questions With 100% Correct Answers 35 - answerWhat is the IQR (Q3-Q1) for this data set: 52, 72, 96, 21, 58, 40, 75? 40 - answerWhat is Q1 for this data set: 52, 72, 96, 21, 58, 40, 75? 75 - answerWhat is Q3 for this data set: 52, 72, 96, 21, 58, 40, 75? 58 - answerWhat is the median for this data set: 52, 72, 96, 21, 58, 40, 75? 4 - answerWhat is the IQR (Q3-Q1) for this data set: 20, 21, 18, 17, 20, 15, 56? 17 - answerWhat is Q1 for this data set: 20, 21, 18, 17, 20, 15...
