Magnitude plot Study guides, Class notes & Summaries
Looking for the best study guides, study notes and summaries about Magnitude plot? On this page you'll find 169 study documents about Magnitude plot.
Page 4 out of 169 results
Sort by
-
CLEP Humanities Study Guide Latest Review
- Other • 38 pages • 2023
- $8.49
- + learn more
What arises from people's natural desire to represent their lives and beliefs? -- >Drama The first real flowering of dramatic arts in the Western tradition occurred where? -- >Classical Greece Building used as dressing room -->Skene Oedipus Rex, Oedipus at Colonus, and Antigone is whom's most famous work? -- >Sophocles The part of a theater stage in front of the curtain -->Proscenium Aeschylus, Sophocles, and Euripides were..? -->The big three of Greek tragedy A trilogy...
-
General Chemistry ACS EXAM Review 168 Questions with Verified Answers,100% CORRECT
- Exam (elaborations) • 14 pages • 2024
- $12.49
- + learn more
General Chemistry ACS EXAM Review 168 Questions with Verified Answers Rutherford's Gold Foil Experiment - CORRECT ANSWER proposed that atoms consist of a tiny, massive, positive nucleus surrounded by electrons nucleus - CORRECT ANSWER contains all the positive charge and nearly all the mass of the atom James Chadwick - CORRECT ANSWER discovered the neutron cathode rays - CORRECT ANSWER move from negative electrode to positive electrode (like electrons in a voltaic cell) Thompson...
-
PTAC 2446 Final Exam Graded A 2023
- Exam (elaborations) • 7 pages • 2023
- $11.49
- + learn more
The term _________ is the sum of the measures in a distribution divided by the number of the measures. - Mean The term ________ is the most frequent measure in a distribution. - Mode Control charts, Pareto diagrams, process flow diagrams, histograms, and check sheets are all ________ tools. - Quantitative tools ISO 9000, ISO 14000, TPM, management tools and benchmarking are all _______ tools. - Non-quantitative A variable that is caused or influenced by another variable is called a/n...
-
(Latest spring 23) AP Physics 1 Unit 7 Progress Check A and B Q&A.
- Other • 11 pages • 2023
- $11.19
- + learn more
AP Physics 1 Unit 7 Progress Check A and B Q&A. AP Physics 1 Unit 7 Progress Check A A group of students must conduct an experiment to determine how the location of an applied force on a classroom door affects the rotational motion of the door. The rotational inertia of the door about its hinges is known. The initial angular velocity of the door is zero. Which of the following lists what measuring devices the students need and the measurements they should take to collect the necessary data ...

-
ASTR 1010 / Astronomy 1010 Final HW Complete Questions & Answers.
- Exam (elaborations) • 12 pages • 2023
- $10.59
- + learn more
Astronomy 1010 Final HW One of the most important earlier steps in understanding stars was to group them into classes called spectral types that could offer clues as to why they are different from one another. Shown here are spectra of some main-sequence stars. Before stars were very well understood, they were classified into an order that was based on the relative strength of hydrogen absorption lines, marked by arrows the image shown. Look at the spectra for stars of different spectral ...

Fear of missing out? Then don’t!

-
ISYE 6501 - Midterm 1 2024 with complete verified solutions.
- Exam (elaborations) • 25 pages • 2024
- $14.99
- + learn more
What do descriptive questions ask? What happened? (e.g., which customers are most alike) What do predictive questions ask? What will happen? (e.g., what will Google's stock price be?) Brainpower Read More 0:05 / 0:15 What do prescriptive questions ask? What action(s) would be best? (e.g., where to put traffic lights) What is a model? Real-life situation expressed as math. What do classifiers help you do? differentiate What is a soft classifier and when is it...
-
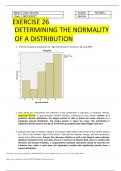
EXERCISE 26 DETERMINING THE NORMALITY OF A DISTRIBUTION TESTBANK 2024 WITH COMPLETE SOLUTIONS
- Exam (elaborations) • 5 pages • 2023
- $15.99
- + learn more
2. How would you characterize the skewness of the distribution in Question 1—positively skewed, negatively skewed, or approximately normal? Provide a rationale for your answer. Answer: In a positively skewed distribution, the largest portion of data is below the mean, whereas in a negatively skewed distribution, the largest portion is above the mean. This distribution is negatively skewed because the age of enrollment got progressively higher/bigger with time 3. Compare the original skewne...
-
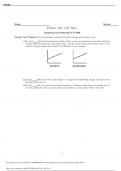
Practice Test 1 for Test 1
- Exam (elaborations) • 6 pages • 2024
- $9.99
- + learn more
Practice Test 1 for Test 1Practice Test Problem 1.1 Let’s think back to some of the data analysis we have done in lab. (a)[11 pt(s) ]Given the theoretical line below, sketch in how you would expect the data to look for 10 data points for systematic and random error. You don’t have to get too technical, but in a few words in the space below them, explain the difference in your drawings. random systematic (b)[3 pt(s) ]Why do we like to plot things in a straight line relationship and get o...
-
MGSC Exam 2 Questions And Answers 100% Verified 2024/2025
- Exam (elaborations) • 3 pages • 2024
- $10.49
- + learn more
MGSC Exam 2 Questions And Answers 100% Verified 2024/2025 How many data series can pie charts graph (hint: they display each value of a series as a percentage of the whole)? For most pie charts, what is the maximum number of pie slices you should have? - answerYou can only plot one data series in a pie chart. 7 slices maximum. What would you call the number values located on top of the bars in a column chart? - answerThe total/data label Which of the following chart types displayed in a ...
-
BUS 375 Exam 2 Questions and Answers Graded A
- Exam (elaborations) • 11 pages • 2023
- $9.99
- + learn more
BUS 375 Exam 2 Questions and Answers Graded A charts visual representation of numeric data chart sheet displayed on its own sheet in the workbook column illustrates data changes over a period of time or shows comparisons among items bar displays comparisons among individual items or values at a specific period of time pie uses one data series to display each vale as a percentage of the whole line displays trends in data over time, emphasizing rate of change area displays the magnitude of c...
