Pie charts Study guides, Class notes & Summaries
Looking for the best study guides, study notes and summaries about Pie charts? On this page you'll find 667 study documents about Pie charts.
Page 4 out of 667 results
Sort by
-
WGU C955 - Module 4: Descriptive Statistics for a Single Variable Questions and Answers Solved Correctly
- Exam (elaborations) • 17 pages • 2023
- $8.99
- + learn more
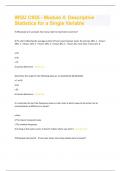
f 200 people are surveyed, how many claim to have had no exercise? {{ Pie chart reflecting the average number of hours exercised per week. No exercise 36%, 1 - 2 hours 28%, 3 - 4 hours 12%, 4 - 5 hours 10%, 5 - 6 hours 8%, 6 - 7 hours 4%, more than 7 hours 2%. }} a 18 b 36 c 72 d Cannot determine - Answer 72 Determine the range for the following data set. {1,24,26,28,32,36,38,40,65} a 1 to 65 b 64 c 65 d Cannot determine - Answer 64 It is important to start the frequency scale on a b...
-
BUS 375 Exam 2 Questions and Answers 100% Solved
- Exam (elaborations) • 10 pages • 2024
- $12.99
- + learn more
BUS 375 Exam 2 Questions and Answers 100% Solved charts visual representation of numeric data chart sheet displayed on its own sheet in the workbook column illustrates data changes over a period of time or shows comparisons among items bar displays comparisons among individual items or values at a specific period of time pie uses one data series to display each vale as a percentage of the whole line displays trends in data over time, emphasizing rate of change area displays the magnitud...

-
Research Methods In Political Science 8th Edition by Michael K. Le Roy - Test Bank
- Exam (elaborations) • 56 pages • 2023
- $25.42
- 1x sold
- + learn more
Comments on the Exercises and Worksheets Each chapter contains a set of worksheets with questions to be answered by the students. These exercises are designed to give the students experience in applying the material covered in the text part of the chapter. Several additional comments need to be made about these worksheets. What Is To Be Done with the Worksheets? Different instructors will handle this matter in different ways. Depending on class size, grading each and every one of the...
-
Basics of Computer Graphics
- Exam (elaborations) • 108 pages • 2024
- $18.99
- + learn more
Computer graphics • It is the creation and manipulation of graphic images by means of a computer. Computer graphics started as a technique to enhance the display of information generated by a computer. This ability to interpret and represent numerical data in pictures has significantly increased the computer’s ability to present information to the user in a clear and understandable form. Large amount of data are rapidly converted into bar charts, pie charts, and graphs. ...
-
MSIS 3223 Exam 1 (Questions & Answers) Rated 100% Correct!!
- Exam (elaborations) • 11 pages • 2024
- $7.99
- + learn more
=CHOOSE(index_num, value1, value2, . . . ) - returns a value from a list based on the position in the list, specified by index_num =HLOOKUP(lookup_value,table_array,row_index_num,[range lookup]) - looks up a value in the top row of a table and returns a value in the same column from a row you specify. =INDEX(array,row_num,col_num) - returns a value or reference of the cell at the intersection of a particular row and column in a given range. =MATCH(lookup_value,lookup_array,match_type) - re...

Make study stress less painful

-
Test Bank for Introduction to Statistics and Data Analysis, 7th Edition by Roxy Peck
- Exam (elaborations) • 418 pages • 2024
- $39.49
- + learn more
Test Bank for Introduction to Statistics and Data Analysis, 7e 7th Edition by Roxy Peck, Chris Olsen. Complete Chapters (Chap 1- 16) are included with answers. 1. THE ROLE OF STATISTICS AND THE DATA ANALYSIS PROCESS: Why Study Statistics? The Nature and Role of Variability. Statistics and the Data Analysis Process. Types of Data and Some Simple Graphical Displays. 2. COLLECTING DATA SENSIBLY: Statistical Studies: Observation and Experimentation. Sampling. Simple Comparative Experiments. More...
-
Statistics final wgu academy exam questions and answers
- Exam (elaborations) • 6 pages • 2024
- $10.69
- + learn more
Statistics final wgu academy exam questions and answers Categorical variables that there is no natural order among the categories nominal variables Categorical variables where there is natural order among the categories (low-high) ordinal variable A measurement which makes sense to talk about the difference between values but not the ratio between values interval Quantitive variables where is makes sense to talk about the difference in ratios. (Income, weight) ratio Valu...
-
WGU C955 - Module 4: Descriptive Statistics for a Single Variable Latest 2023 Already Passed
- Exam (elaborations) • 27 pages • 2023
- $9.99
- + learn more
WGU C955 - Module 4: Descriptive Statistics for a Single Variable Latest 2023 Already Passed If 200 people are surveyed, how many claim to have had no exercise? {{ Pie chart reflecting the average number of hours exercised per week. No exercise 36%, 1 - 2 hours 28%, 3 - 4 hours 12%, 4 - 5 hours 10%, 5 - 6 hours 8%, 6 - 7 hours 4%, more than 7 hours 2%. }} a 18 b 36 c 72 d Cannot determine 72 Determine the range for the following data set. {1,24,26,28,32,36,38,40,65} a 1 to 65 b 64 c 65 ...
-
NAHQ Practice CPHQ Questions | 105 Questions with 100% correct answers | Verified
- Exam (elaborations) • 46 pages • 2023
- $13.99
- + learn more
1- In evaluating "long waiting times," a healthcare quality professional best demonstrates components related to staffing, methods, measures, materials, and equipment utilizing A. a run chart. B. a histogram. C. a pie chart. D. an Ishikawa diagram. - EXPLANATIONS: A. Run charts are used to track data over time. B. Histograms and bar charts are used to show distribution. C. Pie charts are used to compare parts of a whole. D. An Ishikawa (cause and effect) diagram helps to analyze p...
-
BUS 375 Exam 2 Questions and Answers Graded A
- Exam (elaborations) • 11 pages • 2024
- $10.58
- + learn more
BUS 375 Exam 2 Questions and Answers Graded A charts visual representation of numeric data chart sheet displayed on its own sheet in the workbook column illustrates data changes over a period of time or shows comparisons among items bar displays comparisons among individual items or values at a specific period of time pie uses one data series to display each vale as a percentage of the whole line displays trends in data over time, emphasizing rate of change area displays the magnitude of...
