Pie charts and bar charts - Study guides, Class notes & Summaries
Looking for the best study guides, study notes and summaries about Pie charts and bar charts? On this page you'll find 479 study documents about Pie charts and bar charts.
Page 4 out of 479 results
Sort by
-
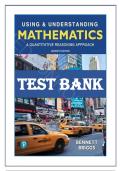
TEST BANK for Using & Understanding Mathematics: A Quantitative Reasoning Approach 7th Edition by Jeffrey Bennett and William Briggs. All 12 Chapters. (complete Download). 431 Pages.
- Exam (elaborations) • 431 pages • 2024
-
- $17.99
- + learn more
I. LOGIC AND PROBLEM SOLVING 1. Thinking Critically Activity: Bursting Bubble 1A. Living in the Media Age In Your World: Fact Checking on the Web 1B. Propositions and Truth Values 1C. Sets and Venn Diagrams Brief Review: Sets of Numbers 1D. Analyzing Arguments Mathematical Insight: Deductive Proof of the Pythagorean Theorem 1E. Critical Thinking in Everyday Life In Your World: Beware of “Up to” Deals 2. Approaches to Problem Solving Activity: Global Melting 2A. Understand, Solve, and Explain...
-
Statistics final wgu academy exam questions and answers
- Exam (elaborations) • 6 pages • 2024
-
- $10.69
- + learn more
Statistics final wgu academy exam questions and answers Categorical variables that there is no natural order among the categories nominal variables Categorical variables where there is natural order among the categories (low-high) ordinal variable A measurement which makes sense to talk about the difference between values but not the ratio between values interval Quantitive variables where is makes sense to talk about the difference in ratios. (Income, weight) ratio Valu...
-
UCF FINAL QMB 3200 STACEY BROOK SUMMER 23 - IMPORTANT INFO IN FIRST FLASHCARD.
- Exam (elaborations) • 36 pages • 2023
-
- $15.49
- + learn more
IMPORTANT PRACTICE TEST INFORMATION!!!! This may be even more helpful than this quizlet!!!! In mindtap go to the left-hand toolbar, select courses, and select this course. You should see a dashboard with the chapters on the left and your recent homework scores on the right. Then on chapter 1 click the down arrow to display all of the sub categories. You should see the last sub category it is chapter 1 review and assignments- click on this then click chapter 1 test prep. This will take yo...
-
Basics of Computer Graphics
- Exam (elaborations) • 108 pages • 2024
- Available in package deal
-
- $18.99
- + learn more
Computer graphics • It is the creation and manipulation of graphic images by means of a computer. Computer graphics started as a technique to enhance the display of information generated by a computer. This ability to interpret and represent numerical data in pictures has significantly increased the computer’s ability to present information to the user in a clear and understandable form. Large amount of data are rapidly converted into bar charts, pie charts, and graphs. ...

-
Test Bank For Applied Statistics in Business and Economics David Doane 6th Ed
- Exam (elaborations) • 871 pages • 2023
-
- $32.00
- + learn more
Applied Statistics in Business and Economics, 6e (Doane) Chapter 3 Describing Data Visually 1) It is easier to read the data values on a 3D column chart than on a 2D column chart. Answer: FALSE Explanation: Height is harder to judge on a 3D chart. Difficulty: 1 Easy Topic: 03.05 Column and Bar Charts Learning Objective: 03-06 Make an effective column chart or bar chart. Bloom's: Understand AACSB: Analytical Thinking Accessibility: Keyboard Navigation 2) The column chart should be avoid...
-
NAHQ Practice CPHQ Questions & Answers 2024
- Exam (elaborations) • 52 pages • 2023
- Available in package deal
-
- $13.99
- + learn more
NAHQ Practice CPHQ Questions & Answers 2024 2011 MOQ 1- In evaluating "long waiting times," a healthcare quality professional best demonstrates components related to staffing, methods, measures, materials, and equipment utilizing A. a run chart. B. a histogram. C. a pie chart. D. an Ishikawa diagram. - ANS-EXPLANATIONS: A. Run charts are used to track data over time. B. Histograms and bar charts are used to show distribution. C. Pie charts are used to compare parts of a whole. ...
-
WGU C955 - Module 4: Descriptive Statistics for a Single Variable Questions and Answers Solved Correctly
- Exam (elaborations) • 17 pages • 2023
- Available in package deal
-
- $8.99
- + learn more
f 200 people are surveyed, how many claim to have had no exercise? {{ Pie chart reflecting the average number of hours exercised per week. No exercise 36%, 1 - 2 hours 28%, 3 - 4 hours 12%, 4 - 5 hours 10%, 5 - 6 hours 8%, 6 - 7 hours 4%, more than 7 hours 2%. }} a 18 b 36 c 72 d Cannot determine - Answer 72 Determine the range for the following data set. {1,24,26,28,32,36,38,40,65} a 1 to 65 b 64 c 65 d Cannot determine - Answer 64 It is important to start the frequency scale on a b...
-
WGU - Applied Healthcare Statistics Exam Questions and Answers 100% pass
- Exam (elaborations) • 11 pages • 2024
-
- $10.50
- + learn more
WGU - Applied Healthcare Statistics Exam Questions and Answers 100% pass Rational numbers Largest number system Rational numbers Can be expressed as a fraction. 4 = 4/1. Also decimals that end or continue forever repeating. Real numbers Any number; Include zero, negative and positive integers. Real numbers are considered this. continuous and can be measured. Discrete data counted; doesn't allow for values between. Every positive whole number has two square roots. ...
-
WGU - Applied Healthcare Statistics Exam Questions and Answers 100% pass
- Exam (elaborations) • 11 pages • 2024
-
- $10.50
- + learn more
WGU - Applied Healthcare Statistics Exam Questions and Answers 100% pass Rational numbers Largest number system Rational numbers Can be expressed as a fraction. 4 = 4/1. Also decimals that end or continue forever repeating. Real numbers Any number; Include zero, negative and positive integers. Real numbers are considered this. continuous and can be measured. Discrete data counted; doesn't allow for values between. Every positive whole number has two square roots. ...
-
Math Knowledge ASVAB Test 2024 With Complete Solutions
- Exam (elaborations) • 129 pages • 2024
-
- $12.99
- + learn more
A: First, the distributive property must be used on the left side. This results in 3x + 6 = 14x -5. The addition property is then used to add 5 to both sides, and then to subtract 3x from both sides, resulting in 11 = 11x. Finally, the multiplication property is used to divide each side by 11. Therefore, x = 1 is the solution. - What is the solution? D: First, like terms are collected to obtain 12 - 5x = -5x + 12. Then, the addition principle is used to move the terms with the variable, so ...

How did he do that? By selling his study resources on Stuvia. Try it yourself! Discover all about earning on Stuvia


