Math 534 we - Study guides, Class notes & Summaries
Looking for the best study guides, study notes and summaries about Math 534 we? On this page you'll find 247 study documents about Math 534 we.
All 247 results
Sort by
 Popular
-
MATH 534 Week 6 Course Project, Part B - Hypothesis Testing andConfidence Intervals (Keller 2023).docx
- Other • 7 pages • 2023
- Available in package deal
-
- $30.48
- 1x sold
- + learn more
MATH 534 Week 6 Course Project, Part B - Hypothesis Testing andConfidence Intervals (Keller 2023).docx
-
MATH 534 Week 2 Course Project Part A - Exploratory Data Analysis
- Other • 6 pages • 2023
- Available in package deal
-
- $24.99
- 1x sold
- + learn more
MATH 534 Week 2 Course Project Part A - Exploratory Data Analysis
-
MATH 534 Week 7 Course Project, Final Part C; Regression and Correlation Analysis
- Other • 4 pages • 2023
- Available in package deal
-
- $25.49
- 1x sold
- + learn more
Final Project: Regression and Correlation Analysis Use the dependent variable (labeled Y) and one of the independent variables (labeled X1, X2, and X3) in the data file. Select and use one independent variable throughout this analysis. Use Excel to perform the regression and correlation analysis to answer the following. The week 6 spreadsheet can ... helpful in this work. 1. Generate a scatterplot for the ... dependent variable (Y) and the ... independent variable (X), including the graph of t...
-
MATH 534 Week 2 Course Project, Part A - Exploratory Data Analysis (Keller 2023)
- Other • 6 pages • 2023
- Available in package deal
-
- $30.48
- + learn more
This is Project A, exploratory data analysis will be conducted, and descriptive statistics is applied to three individual and three pairs of variables. Analysis and interpretation will be done based on the data.
-
MATH 534 Week 7 Course Project, Final Part C_ Regression and Correlation Analysis (Keller 2023).docx
- Other • 4 pages • 2023
- Available in package deal
-
- $30.48
- + learn more
MATH 534 Week 7 Course Project, Final Part C_ Regression and Correlation Analysis (Keller 2023).docx
-
MATH 534 Week 4 Quiz (v2)
- Exam (elaborations) • 64 pages • 2023
- Available in package deal
-
- $25.48
- + learn more
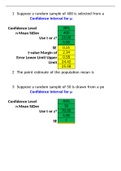
1. Question: Suppose a random sample of 400 is selected from a population with a standard deviation of 5. If the sample mean is 25, the 98% confidence interval to estimate the population mean is between ________. 2. Question: The point estimate of the population mean is _________. 3. Question: Suppose a random sample of 50 is drawn from a population whose standard deviation is unknown. If the sample mean is 70 and the sample standard deviation is 5, the 92% confidence interval to estimate the ...
-
MATH 534 Week 4 Quiz (v2)
- Exam (elaborations) • 64 pages • 2023
- Available in package deal
-
- $24.99
- + learn more
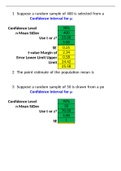
1 Suppose a random sample of 400 is selected from a 2 The point estimate of the population mean is 3 Suppose a random sample of 50 is drawn from a po 4 Suppose a researcher is interested in understanding 5 Brian Vanecek, VP of Operations at Portland Trust B 6 James Desreumaux, VP of Human Resources of Amer 7 A department store finds that in a random sample o 13 A large trucking company wants to estimate the pro
-
MATH 534 Week 4 Quiz
- Exam (elaborations) • 64 pages • 2023
- Available in package deal
-
- $23.48
- + learn more
1. Question: Suppose a random sample of 400 is selected from a population with a standard deviation of 5. If the sample mean is 25, the 98% confidence interval to estimate the population mean is between ________. 2. Question: The point estimate of the population mean is _________. 3. Question: Suppose a random sample of 50 is drawn from a population whose standard deviation is unknown. If the sample mean is 70 and the sample standard deviation is 5, the 92% confidence interval to estimate the ...
-
MATH 534 Week 5 Discussion; Hypothesis Testing
- Other • 92 pages • 2023
- Available in package deal
-
- $18.48
- + learn more
For this discussion, create and post a 1-2 minute video describing a real-world example of whenahypothesistestcouldbeused.Yourvideoshouldalsoincludeanumericalexampleforanotherstudent to work through in their response. The example can use real data or data that you makeup, such as values for the mean, standard deviation, and sample size. Be sure to note if thestandard deviation is from the population or the sample.In your responses to other students,showtheworkand describe thestepsyou usesto solv...
-
MATH 534 Week 7 Discussion; Predictive Analytics
- Other • 71 pages • 2023
- Available in package deal
-
- $18.48
- + learn more
Predictive analytics in business is an important application of multiple regression analysis.Generallyspeaking,whatismeantbypredictiveanalytics?Asabusinessowner,howcouldyouuseregressionanalysisand predictive analyticsto increase your company'ssales?

How much did you already spend on Stuvia? Imagine there are plenty more of you out there paying for study notes, but this time YOU are the seller. Ka-ching! Discover all about earning on Stuvia


