Stat200 week 7 - Study guides, Class notes & Summaries
Looking for the best study guides, study notes and summaries about Stat200 week 7? On this page you'll find 16 study documents about Stat200 week 7.
All 16 results
Sort by
-
STAT 200 STAT200 WEEK 7 HOMEWORK with accurate SOLUTION (UMUC)
- Exam (elaborations) • 8 pages • 2022
-
- $11.00
- + learn more
STAT 200 STAT200 WEEK 7 HOMEWORK with accurate SOLUTION (UMUC) STAT 200 STAT200 WEEK 7 HOMEWORK SOLUTION (UMUC) Anquanette Sterling STAT Week 7 Homework #1) 2 Points 2. The formula for a regression equation is Y’ = 2X + 9. a. What would be the predicted score for a person scoring 6 on X? Y = 2(6) + 9 = 12+9 = 21 b. If someone’s predicted score was 14, what was this person’s score on X? 14 = 2X + 9 -9 -9 5 = 2X 2.5 = X #2) 2 Points 6. For the X,Y data below ...
-
STAT 200 MIDTERM QUESTIONS WITH CORRECT ANSWERS
- Exam (elaborations) • 9 pages • 2023
-
- $7.99
- + learn more
Which of the following are possible values of Pearson's r? CORRECT ANSWER Between -1 and 1 In the population of all Olympic freestyle wrestlers, is there a correlation between weight (in kilograms) and height (in centimeters)? Weight (in kilograms) is a ______ variable. Height (in centimeters) is a _______ variable. CORRECT ANSWER quantitative A farmer wants to compare the milk production of dairy cattle fed different types of feed: (1) Purina Mills, (2) Nutrena, and (3) Modesto. They h...
-
STAT 200 Week 7 Homework Problems / STAT200 Week 7 Homework Problems | 100% Correct, Already Graded A | Rated 100%
- Exam (elaborations) • 15 pages • 2021
- Available in package deal
-
- $8.49
- + learn more
STAT 200 Week 7 Homework Problems / STAT200 Week 7 Homework Problems | 100% Correct, Already Graded A | Rated 100%
STAT 200 Week 7 Homework Problems / STAT200 Week 7 Homework Problems | 100% Correct, Already Graded A | Rated 100%
-
STAT 200 Week 1 To Week 7 Homework Problems / STAT200 Week 1 To Week 7 Homework Problems | 100% Correct, Already Graded A | Rated 100%
- Package deal • 7 items • 2021
-
- $35.49
- + learn more
STAT 200 Week 1, Week 2, Week 3, Week 4, Week 5, Week 6 And Week 7 Homework Problems / STAT200 Week 1, Week 2, Week 3, Week 4, Week 5, Week 6 And Week 7 Homework Problems | 100% Correct, Already Graded A | Rated 100%
-
STAT 200 Week 7 Homework Problems / STAT200 Week 7 Homework Problems (V2): Questions & Answers (NEW, 2021)(Verified Answers, Already Graded A)
- Exam (elaborations) • 11 pages • 2021
-
Available in package deal
-
- $14.49
- + learn more
STAT 200 Week 7 Homework Problems / STAT200 Week 7 Homework Problems (V2): Questions & Answers (NEW, 2021)(Verified Answers, Already Graded A)
-
STAT 200 Week 7 Homework Problems / STAT200 Week 7 Homework Problems (V1): Questions & Answers (NEW, 2021)(Verified Answers, Already Graded A)
- Exam (elaborations) • 8 pages • 2021
-
Available in package deal
-
- $14.49
- + learn more
STAT 200 Week 7 Homework Problems / STAT200 Week 7 Homework Problems (V1): Questions & Answers (NEW, 2021)(Verified Answers, Already Graded A)
![STAT 200 Week 7 Homework Problems [SOLVED > GRADED A]](/docpics/6138b720dda7d_1286896.jpg)
-
STAT 200 Week 7 Homework Problems [SOLVED > GRADED A]
- Exam (elaborations) • 14 pages • 2021
- Available in package deal
-
- $9.99
- + learn more
Table #10.1.6 contains the value of the house and the amount of rental income in a year that the house brings in (“Capital and rental,” 2013). Create a scatter plot and find a regression equation between house value and rental income. Then use the regression equation to find the rental income a house worth $230,000 and for a house worth $400,000. Which rental income that you calculated do you think is closer to the true rental income? Why? Table #10.1.6: Data of House Value versus Renta...
-
STAT 200 Week 7 Homework Problems - STAT200 Week 7: Introduction To Statistics Quiz
- Exam (elaborations) • 9 pages • 2021
-
- $15.40
- + learn more
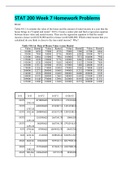
STAT 200 Week 7 Homework Problems 10.1.2 Table #10.1.6 contains the value of the house and the amount of rental income in a year that the house brings in ("Capital and rental," 2013). Create a scatter plot and find a regression equation between house value and rental income. Then use the regression equation to find the rental income a house worth $230,000 and for a house worth $400,000. Which rental income that you calculated do you think is closer to the true rental income? Why? Table ...
-
STAT 200 Week 7 Homework Problems (answered) / STAT 200 STAT200 WEEK 7 HOMEWORK SOLUTION (UMUC)
- Other • 14 pages • 2021
- Available in package deal
-
- $8.49
- + learn more
STAT 200 Week 7 Homework Problems (answered) / STAT 200 STAT200 WEEK 7 HOMEWORK SOLUTION (UMUC) STAT 200 Week 7 Homework Problems 10.1.2 Table #10.1.6 contains the value of the house and the amount of rental income in a year that the house brings in (“Capital and rental,” 2013). Create a scatter plot and find a regression equation between house value and rental income. Then use the regression equation to find the rental income a house worth $230,000 and for a house worth $400,000. Which r...

That summary you just bought made someone very happy. Also get paid weekly? Sell your study resources on Stuvia! Discover all about earning on Stuvia

