Datascience24
Please message me using Send Message option for new assignment requests.
- 158
- 0
- 10
Community
- Followers
- Following
11 Reviews received
168 items
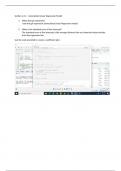
Week 14
Using the code in section 4.4.1, create a generalized linear regression model. Extract the coefficient estimates into a tidy dataframe. ANSWER THE FOLLOWING QUESTIONS: 1. What does glr represent? 2. What is the standard error of the intercept? Use the code provided to create a coefficient plot. ANSWER THE FOLLOWING QUESTIONS: 3. Which two coefficients have the tightest confidence intervals. 4. Why does the y axis appear on the bottom of the chart while the x axis is on the left side? Us...
- Book & Paket-Deal
- Summary
- • 3 pages •
Using the code in section 4.4.1, create a generalized linear regression model. Extract the coefficient estimates into a tidy dataframe. ANSWER THE FOLLOWING QUESTIONS: 1. What does glr represent? 2. What is the standard error of the intercept? Use the code provided to create a coefficient plot. ANSWER THE FOLLOWING QUESTIONS: 3. Which two coefficients have the tightest confidence intervals. 4. Why does the y axis appear on the bottom of the chart while the x axis is on the left side? Us...
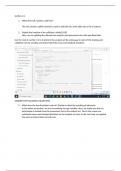
Week 13
Using the code in section 4.4 create 10 subsets of the okc_train data set. Create an analysis set and an assessment set, ANSWER THE FOLLOWING QUESTION: 1. What does sdf_random_split() do? 2. Explain the function of (rbind, vfolds[2:10]) Use the code in section 4.4 to transform the analysis set by scaling age in each of the training and validation sets by creating a function that finds mean and standard deviation. ANSWER THE FOLLOWING QUESTIONS: 3. What does the function(data) code do? Ex...
- Book & Paket-Deal
- Summary
- • 4 pages •
Using the code in section 4.4 create 10 subsets of the okc_train data set. Create an analysis set and an assessment set, ANSWER THE FOLLOWING QUESTION: 1. What does sdf_random_split() do? 2. Explain the function of (rbind, vfolds[2:10]) Use the code in section 4.4 to transform the analysis set by scaling age in each of the training and validation sets by creating a function that finds mean and standard deviation. ANSWER THE FOLLOWING QUESTIONS: 3. What does the function(data) code do? Ex...
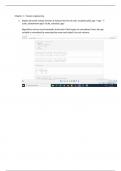
Week 12
Using the code in section 4.3 to scale the age variable. ANSWER THE FOLLOWING QUESTIONS: 1. Explain what the mutate function is doing in this line of code: mutate(scaled_age = (age - !!scale_values$mean-age) / !!scale_values$sd_age) 2. What do the two exclamation marks next to each other do? Use the code in the book to create a histogram of Scaled Age ANSWER THESE QUESTION: 3. Approximately how many profiles in the training set fall in the 0 bin? Using the code in section 4.3, aggregat...
- Book & Paket-Deal
- Summary
- • 4 pages •
Using the code in section 4.3 to scale the age variable. ANSWER THE FOLLOWING QUESTIONS: 1. Explain what the mutate function is doing in this line of code: mutate(scaled_age = (age - !!scale_values$mean-age) / !!scale_values$sd_age) 2. What do the two exclamation marks next to each other do? Use the code in the book to create a histogram of Scaled Age ANSWER THESE QUESTION: 3. Approximately how many profiles in the training set fall in the 0 bin? Using the code in section 4.3, aggregat...
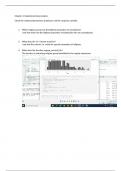
Week 11
Continue to use the code in Chapter 4 to look at the relationship between predictors and the response variable. ANSWER THESE QUESTIONS: 1. Which religious group has the highest proportion of unemployed? 2. What does the 'se' column stand for? 3. What does the function regexp_extract() do? 4. Which ethnicity has the highest proportion of unemployed? Use the code provided to create a box plot of religion v. unemployed. ANSWER THE FOLLOWING QUESTIONS: 5. What does the box plot s...
- Book & Paket-Deal
- Summary
- • 4 pages •
Continue to use the code in Chapter 4 to look at the relationship between predictors and the response variable. ANSWER THESE QUESTIONS: 1. Which religious group has the highest proportion of unemployed? 2. What does the 'se' column stand for? 3. What does the function regexp_extract() do? 4. Which ethnicity has the highest proportion of unemployed? Use the code provided to create a box plot of religion v. unemployed. ANSWER THE FOLLOWING QUESTIONS: 5. What does the box plot s...
Week 10
Follow the instructions in the book in Chapter 4 to read in the okc data. Explain what each element in the code is doing. Glimpse() the data. ANSWER THESE QUESTIONS; 1.What is the data type of the essay fields? 2.What do they contain? 3.How do you know the data is in Spark? Continue to use the code in Chapter 4 to add a response variable. ANSWER THESE QUESTIONS: 4. What is the response variable added? 5. Explain how the response variable is aggregated. 6. What is the tally? Continue t...
- Book & Paket-Deal
- Summary
- • 3 pages •
Follow the instructions in the book in Chapter 4 to read in the okc data. Explain what each element in the code is doing. Glimpse() the data. ANSWER THESE QUESTIONS; 1.What is the data type of the essay fields? 2.What do they contain? 3.How do you know the data is in Spark? Continue to use the code in Chapter 4 to add a response variable. ANSWER THESE QUESTIONS: 4. What is the response variable added? 5. Explain how the response variable is aggregated. 6. What is the tally? Continue t...
Week 9
The text is Mastering Spark with R. Using your sc connection and the correct Java version: 1. explain what each element is doing in the following code blocks and the difference between these two code blocks that explains the difference in the output. Explain what the output tables mean: >cars %>% + ml_linear_regression(mpg ~ .) %>% + summary() >cars %>% + ml_linear_regression(mpg ~ hp + cyl) %>% + summary() cars %>% + ml_linear_regression(mpg ~ ...
- Book & Paket-Deal
- Summary
- • 3 pages •
The text is Mastering Spark with R. Using your sc connection and the correct Java version: 1. explain what each element is doing in the following code blocks and the difference between these two code blocks that explains the difference in the output. Explain what the output tables mean: >cars %>% + ml_linear_regression(mpg ~ .) %>% + summary() >cars %>% + ml_linear_regression(mpg ~ hp + cyl) %>% + summary() cars %>% + ml_linear_regression(mpg ~ ...
Week 8
The text is Mastering Spark with R. Making sure that you are using the sc connection and the correct version of Java, install the ggplot2 library. Run the following code: >car_group <- cars %>% + group_by(cyl) %>% + summarize(mpg = sum(mpg, =true)) + collect() %>% + print() Using similar code determine the average mpg for each cylinder count. Plot both results using the following code: >ggplot(aes(r(cyl), mpg), data = car_group) + geom_col(fill = #) + coord_flip...
- Book & Paket-Deal
- Summary
- • 4 pages •
The text is Mastering Spark with R. Making sure that you are using the sc connection and the correct version of Java, install the ggplot2 library. Run the following code: >car_group <- cars %>% + group_by(cyl) %>% + summarize(mpg = sum(mpg, =true)) + collect() %>% + print() Using similar code determine the average mpg for each cylinder count. Plot both results using the following code: >ggplot(aes(r(cyl), mpg), data = car_group) + geom_col(fill = #) + coord_flip...
Week 7
The text is Mastering Spark with R. Using the sc connection that you have built earlier and making sure that you are still using Java 8, install the corr library and execute the following lines of code: >ml_corr(cars) >correlate(cars, use = "", method = "pearson" >correlate(cars, use = "", method = "pearson" %>% shave() %>% rplot() Submit a Word doc with screenshots of the results of running the code. Explain what the chart is showing. Expl...
- Book & Paket-Deal
- Summary
- • 3 pages •
The text is Mastering Spark with R. Using the sc connection that you have built earlier and making sure that you are still using Java 8, install the corr library and execute the following lines of code: >ml_corr(cars) >correlate(cars, use = "", method = "pearson" >correlate(cars, use = "", method = "pearson" %>% shave() %>% rplot() Submit a Word doc with screenshots of the results of running the code. Explain what the chart is showing. Expl...
Week 6
The text is Mastering Spark with R. Using the sc connection with Java 8, execute the following lines of code: >summarize(cars, mpg_percentile = percentile(mpg, 0.25) >summarize(cars, mpg_percentile = percentile(mpg, 0.25) %>% show_query() >summarize(cars, mpg_percentile = percentile(mpg, array(0.25, 0.5, 0.75) )) >summarize(cars, mpg_percentile = percentile(mpg, array(0.25, 0.5, 0.75) )) %>% mutate(mpg_percentile = explode(mpg_percentile))
- Book & Paket-Deal
- Summary
- • 3 pages •
The text is Mastering Spark with R. Using the sc connection with Java 8, execute the following lines of code: >summarize(cars, mpg_percentile = percentile(mpg, 0.25) >summarize(cars, mpg_percentile = percentile(mpg, 0.25) %>% show_query() >summarize(cars, mpg_percentile = percentile(mpg, array(0.25, 0.5, 0.75) )) >summarize(cars, mpg_percentile = percentile(mpg, array(0.25, 0.5, 0.75) )) %>% mutate(mpg_percentile = explode(mpg_percentile))
Week 5
The text is Mastering Spark with R. Create a new connection to your Spark cluster -. sc Make sure that you are using the correct version of Java Execute the following code: >summarize_all(cars, max) >summarize_all(cars, min) >summarize_all(cars, mean) >summarize_all(cars, mean)%>% show_query() >cars %>% mutate(transmission = ifelse(am ==0, "automatic", "manual")) %>% group_by(transmission) %>% summarize_all(mean)
- Book & Paket-Deal
- Summary
- • 4 pages •
The text is Mastering Spark with R. Create a new connection to your Spark cluster -. sc Make sure that you are using the correct version of Java Execute the following code: >summarize_all(cars, max) >summarize_all(cars, min) >summarize_all(cars, mean) >summarize_all(cars, mean)%>% show_query() >cars %>% mutate(transmission = ifelse(am ==0, "automatic", "manual")) %>% group_by(transmission) %>% summarize_all(mean)

Nutrition_Case_Study_ML_Week8_NEC
Fundamentals_of_general_additive_models_ML_Week7_NEC
Santander_Bank_Case_Study_ML_Week6_NEC
Fundamentals_of_ensemble_modeling_Week5_NEC
Fundamentals_of_ensemble_modeling_Week5_NEC