Ggplot Studienführer, Klassennotizen & Zusammenfassungen
Suchst du nach den besten Studienführern, Studiennotizen und Zusammenfassungen über Ggplot? Auf dieser Seite findest du 18 Studienunterlagen zu Ggplot.
All 18 Ergebnisse
Sortieren nach
 Beliebt
-
ISYE 6501 Final Quiz latest 2023
- Prüfung • 32 Seiten • 2024
- 16,63 €
- 1x verkauft
- + erfahre mehr
Skip to document Search for courses, books or documents University High School Books Sign in Information AI Chat GT Students Final Quiz ISYE6501x Courseware ed X GT Students Final Quiz ISYE6501x Courseware ed X Course Elementary Italian (ITAL 1) University Pasadena City College Academic year: 2021/2022 Uploaded by: Anonymous Student Pasadena City College Recommended for you 11 Med surg Immunity HIV AIDS Lecture Notes Med surg Immunity HIV AIDS Lecture Notes...
-
Week 8
- Zusammenfassung • 4 Seiten • 2023
- 9,69 €
- 1x verkauft
- + erfahre mehr
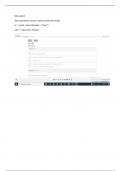
The text is Mastering Spark with R. Making sure that you are using the sc connection and the correct version of Java, install the ggplot2 library. Run the following code: >car_group <- cars %>% + group_by(cyl) %>% + summarize(mpg = sum(mpg, =true)) + collect() %>% + print() Using similar code determine the average mpg for each cylinder count. Plot both results using the following code: >ggplot(aes(r(cyl), mpg), data = car_group) + geom_col(fill = #) + coord_flip...
-
Solutions for Probability, Statistics, and Data, A Fresh Approach Using R, 1st Edition Speegle (All Chapters included)
- Prüfung • 238 Seiten • 2024
- 27,25 €
- + erfahre mehr
Complete Solutions Manual for Probability, Statistics, and Data, A Fresh Approach Using R, 1st Edition by Darrin Speegle; Bryan Clair ; ISBN13: 9780367436674. (Full Chapters included Chapter 1 to 13)....1. Data in R. 2. Probability. 3. Discrete Random Variables. 4. Continuous Random Variables. 5. Simulation of Random Variables. 6. Data Manipulation. 7. Data Visualization with ggplot. 8. Inference on the Mean. 9. Rank Based Tests. 10. Tabular Data. 11. Simple Linear Regression. 11. Analysis of Va...
-
SOA PA Exam QUESTIONS AND ANSWERS
- Prüfung • 21 Seiten • 2023
- 11,54 €
- + erfahre mehr
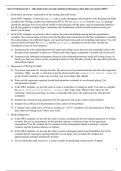
What to examine when assessing the bivariate relationship between a Factor predictor variable and a binary target variable? - Answer- A table to asses (with rows as factor levels) the mean probabilities, counts of observations of each factor, and counts of each observation of each binary target. What to examine when assessing the bivariate relationship between a Continuous predictor variable and a binary target variable? - Answer- - A graph with separate histograms for a continuous variable, ...
-
Plotting_Visual_Analytics_Week4_NEC_Solved
- Prüfung • 19 Seiten • 2023
- 9,69 €
- + erfahre mehr
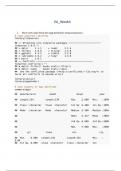
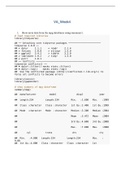
1. Show meta data from the mpg dataframe using summary(). 2. Show metadata from the gapminder dataframe 3. assign ggplot(data = gapminder, mapping = aes(x = gdpPercap, y = lifeExp) to the variable 'p' 4. find the structure of the p object. 5. add () to the p object. Show p. 6. replace () with h(). Show p. 7. return to and add h(). Show p. 8. add the linear element to the h function. Show p. 9. change the x axis scare to log10. Show p. 10. try scale_y_log10(). Show p. 11. change the...

Angst, etwas zu verpassen? Dann tu es nicht!

-
Visual_Analytics_Week4_NEC_Solved
- Prüfung • 19 Seiten • 2023
- 9,69 €
- + erfahre mehr
Show meta data from the mpg dataframe using summary(). Show metadata from the gapminder dataframe assign ggplot(data = gapminder, mapping = aes(x = gdpPercap, y = lifeExp) to the variable 'p' find the structure of the p object. add () to the p object. Show p. replace () with h(). Show p. return to and add h(). Show p. add the linear element to the h function. Show p. change the x axis scare to log10. Show p. try scale_y_log10(). Show p. change the method to gam from lm. Show p. re...
-
Stat 311 Homework 3 – this homework uses the student performance data that was used in HW2 - ALL ANSWERS ARE CORRECT
- Prüfung • 2 Seiten • 2023
- 7,38 €
- + erfahre mehr
Stat 311 Homework 3 – this homework uses the student performance data that was used in HW2 1 1. Some basic univariate visualization of the reading and math scores. In the HW3 template, we provide ggplot code to make histograms and boxplots of the Reading and Math variables (the Writing variable was explored in HW2). We use ggarrange from the ggpubr package (install the package first if you did not install it when playing with the demo code in Quantitative.Rmd) to put all four graphs in a...

-
Georgia Tech ISYE6501 Week 2 HW, 100% pass rate
- Prüfung • 10 Seiten • 2023
- 7,85 €
- + erfahre mehr
Georgia Tech ISYE6501 Week 2 HW, 100% pass rate, Document Content and Description Below ISYE6501 Week 2 HW Question 4.1 At my job we use clustering in an image system to understand the minerals that are coming into our processing facility. Comparing the images to known mineral images, the system can quantify the mineral content and monitor the colors of the minerals to compare to centroids of the clusters. Question 4.2 library(kernlab) library(ggplot2) ## Warning: package 'ggplot2' was built...

-
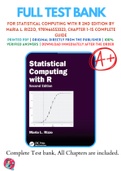
Test Banks For Statistical Computing with R 2nd Edition by Maria L. Rizzo, 9781466553323, Chapter 1-15 Complete Guide
- Prüfung • 242 Seiten • 2022
- 26,25 €
- + erfahre mehr
Statistical Computing with R 2nd Edition 3323 7760 4, 2, 2, 3323, 3330, 2760 1 Introduction 1.1 Statistical Computing 1.2 The R Environment 1.3 Getting Started with R and RStudio 1.4 Basic Syntax 1.5 Using the R Online Help System 1.6 Distributions and Statistical Tests 1.7 Functions 1.8 Arrays, Data Frames, and Lists 1.9 Formula Specification 1.10 Graphics 1.11 Introduction to ggplot 1.12 Workspace and Files 1.12.1 The Working Directory 1.12...
-
Test Banks For Statistical Computing with R 2nd Edition by Maria L. Rizzo, 9781466553323, Chapter 1-15 Complete Guide
- Prüfung • 242 Seiten • 2022
- 26,28 €
- + erfahre mehr
Statistical Computing with R 2nd Edition 3323 7760 4, 2, 2, 3323, 3330, 2760 1 Introduction 1.1 Statistical Computing 1.2 The R Environment 1.3 Getting Started with R and RStudio 1.4 Basic Syntax 1.5 Using the R Online Help System 1.6 Distributions and Statistical Tests 1.7 Functions 1.8 Arrays, Data Frames, and Lists 1.9 Formula Specification 1.10 Graphics 1.11 Introduction to ggplot 1.12 Workspace and Files 1.12.1 The Working Directory 1.12...
