CHAPTER 4
Demand, Supply, and Market Equilibrium
Perfectly competitive market: a market with many sellers and buyers
of a homogeneous product and no barriers to entry.
It has many sellers and buyers, so no single buyer or seller can affect the
market price.
On the demand side of a market, consumers buy products from firms.
How much of a particular product are consumers willing to buy during a
particular period?
Variables that affect an individual consumer’s decision:
- The price of the product.
- The consumer’s income.
- The price of substitute goods.
- The price of complementary goods.
- The consumer’s preferences or tastes and advertising that may
influence preferences.
- The consumer’s expectations about future prices.
Quantity demanded: the amount of a product that consumers are
willing and able to buy.
Demand schedule: a table that shows the relationship between the price
of a product and the quantity demanded, ceteris paribus.
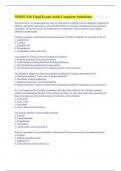
Individual demand curve: a curve that shows the relationship between
the price of a good and quantity demanded by an individual consumer,
ceteris paribus.
To get the data for a single demand curve, we change only the price and
observe how a consumer responds to the price change.
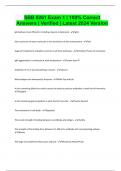
Law of demand: there is a negative relationship between price and
quantity demanded, ceteris paribus.
Change in quantity demanded: a change in the quantity consumers
are willing and able to buy when the price changes; represented
graphically by movement along the demand curve.
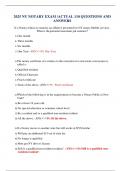
Market demand curve: a curve showing the relationship between price
and quantity demanded by all consumers, ceteris paribus.
The market demand curve is the horizontal sum of the individual demand
curves.
On the supply side of a market, firms sell their products to consumers.
How much of your product are you willing to produce and sell?
, It depends on the following variables:
- The price of the product.
- The wage paid to workers.
- The price of materials.
- The cost of capital.
- The state of production technology.
- Producers’ expectations of future prices.
- Taxes paid to the government or subsidies.
Subsidy: payments from the government to firms to produce a product.
Quantity supplied: the amount of a product that firms are willing and
able to sell.
Supply schedule: a table that shows the relationship between the price
of a product and quantity supplied, ceteris paribus.
In a supply schedule, a change in quantity results from a change in price
alone.
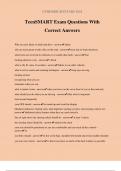
Individual supply curve: a curve showing the relationship between
price and quantity supplied by a single firm, ceteris paribus.
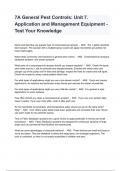
Law of supply: there is a positive relationship between price and
quantity supplied, ceteris paribus.
Change in quantity supplied: a change in the quantity firms are willing
and able to sell when the price changes; represented graphically by
movement along the supply curve.
Minimum supply price: the lowest price at which a product will be
supplied.
A higher price encourages a firm to increase its output by purchasing
more materials and hiring more workers. To increase her workforce, Lola
might be forced to pay overtime or hire workers who are more costly or
less productive than the original workers. But the higher price makes it
worthwhile to incur these higher costs.
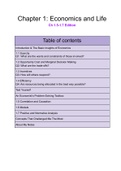
Market supply curve: a curve showing the relationship between the
market price and quantity supplied by all firms, ceteris paribus.
To explain the positive slope, consider the two responses by firms to an
increase in price:
- Individual firm A higher price encourages a firm to increase its
output by purchasing more materials and hiring more workers.
- New firms In the long run, new firms can enter the market and
existing firms can expand their production facilities to produce more
output. The new firms may have higher production costs than the
original firms, but the higher output prices makes it worthwhile to
enter the market, even with higher costs.
Demand, Supply, and Market Equilibrium
Perfectly competitive market: a market with many sellers and buyers
of a homogeneous product and no barriers to entry.
It has many sellers and buyers, so no single buyer or seller can affect the
market price.
On the demand side of a market, consumers buy products from firms.
How much of a particular product are consumers willing to buy during a
particular period?
Variables that affect an individual consumer’s decision:
- The price of the product.
- The consumer’s income.
- The price of substitute goods.
- The price of complementary goods.
- The consumer’s preferences or tastes and advertising that may
influence preferences.
- The consumer’s expectations about future prices.
Quantity demanded: the amount of a product that consumers are
willing and able to buy.
Demand schedule: a table that shows the relationship between the price
of a product and the quantity demanded, ceteris paribus.
Individual demand curve: a curve that shows the relationship between
the price of a good and quantity demanded by an individual consumer,
ceteris paribus.
To get the data for a single demand curve, we change only the price and
observe how a consumer responds to the price change.
Law of demand: there is a negative relationship between price and
quantity demanded, ceteris paribus.
Change in quantity demanded: a change in the quantity consumers
are willing and able to buy when the price changes; represented
graphically by movement along the demand curve.
Market demand curve: a curve showing the relationship between price
and quantity demanded by all consumers, ceteris paribus.
The market demand curve is the horizontal sum of the individual demand
curves.
On the supply side of a market, firms sell their products to consumers.
How much of your product are you willing to produce and sell?
, It depends on the following variables:
- The price of the product.
- The wage paid to workers.
- The price of materials.
- The cost of capital.
- The state of production technology.
- Producers’ expectations of future prices.
- Taxes paid to the government or subsidies.
Subsidy: payments from the government to firms to produce a product.
Quantity supplied: the amount of a product that firms are willing and
able to sell.
Supply schedule: a table that shows the relationship between the price
of a product and quantity supplied, ceteris paribus.
In a supply schedule, a change in quantity results from a change in price
alone.
Individual supply curve: a curve showing the relationship between
price and quantity supplied by a single firm, ceteris paribus.
Law of supply: there is a positive relationship between price and
quantity supplied, ceteris paribus.
Change in quantity supplied: a change in the quantity firms are willing
and able to sell when the price changes; represented graphically by
movement along the supply curve.
Minimum supply price: the lowest price at which a product will be
supplied.
A higher price encourages a firm to increase its output by purchasing
more materials and hiring more workers. To increase her workforce, Lola
might be forced to pay overtime or hire workers who are more costly or
less productive than the original workers. But the higher price makes it
worthwhile to incur these higher costs.
Market supply curve: a curve showing the relationship between the
market price and quantity supplied by all firms, ceteris paribus.
To explain the positive slope, consider the two responses by firms to an
increase in price:
- Individual firm A higher price encourages a firm to increase its
output by purchasing more materials and hiring more workers.
- New firms In the long run, new firms can enter the market and
existing firms can expand their production facilities to produce more
output. The new firms may have higher production costs than the
original firms, but the higher output prices makes it worthwhile to
enter the market, even with higher costs.