100% satisfaction guarantee Immediately available after payment Both online and in PDF No strings attached
logo-home
Exam PL-300 Microsoft Power BI Data Analyst Discover data analysis || with 100% Verified Solutions. $11.09   Add to cart

Exam (elaborations)

Exam PL-300 Microsoft Power BI Data Analyst Discover data analysis || with 100% Verified Solutions.

 0 view  0 purchase
  • Course
  • L-300 Microsoft Power BI Data Analyst Discov
  • Institution
  • L-300 Microsoft Power BI Data Analyst Discov

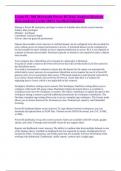
Manage a Power BI workspace, privilege in terms of schedule data refresh correct answers Admin: Mos privileged Member : privileged Contributor: least privileged Viewer: does not grant the permissions Dataset discoverable correct answers A certified dataset can be configured to be discoverable...

[Show more]
Preview 2 out of 8  pages

  • September 10, 2024
  • 8
  • 2024/2025
  • Exam (elaborations)
  • Questions & answers
  • L-300 Microsoft Power BI Data Analyst Discov
  • L-300 Microsoft Power BI Data Analyst Discov
avatar-seller
FullyFocus
Exam PL-300 Microsoft Power BI Data Analyst Discover
data analysis || with 100% Verified Solutions.
Manage a Power BI workspace, privilege in terms of schedule data refresh correct answers
Admin: Mos privileged
Member : privileged
Contributor: least privileged
Viewer: does not grant the permissions

Dataset discoverable correct answers A certified dataset can be configured to be discoverable for
users without access to request permissions to access. A promoted dataset can be configured to
be discoverable for users without access to request permissions to access. RLS is not required on
a dataset to become discoverable. Premium (capacity or shared) is not required to make a dataset
discoverable

Your company has a SharePoint server located in a datacentre in Montreal.
You plan to create a report in the Power BI service that will use Microsoft Excel files stored on
the SharePoint server.
You need to recommend a solution to ensure that the dataset for the report can automatically
refresh daily correct answers An on-premises SharePoint server requires the use of a Power BI
gateway since it's an on-premises data source. VPN-based solutions would provide connectivity
to an Azure virtual network, but not Power BI service. Azure Data Box is a solution for
migrating data to Azure, which is not applicable in this scenario.

Workplace OneDrive setting correct answers The Workspace OneDrive setting allows you to
configure a Microsoft 365 group whose SharePoint Online document library is available to
workspace users once the workspace is created. The Allow contributors to update the app for this
workspace setting is meant to provide additional permissions for workspace contributors. The
Develop a template app setting allows you to set up a template app workspace. The license mode
allows you to choose between Pro, Premium per user, Premium per capacity, and Embedded
licensing.

Power BI dashboard theme correct answers To copy themes between workspaces, you can
download and upload them as JSON files. Themes use the JSON file format, not CSV, YAML,
or XML.

Power BI dashboard, set up alert correct answers Alerts are available with KPI visuals, gauges
/ɡeɪdʒ/, and cards. Treemaps and waterfall visuals do not support alerts.

Reports and dashboard correct answers The ability to combine data from multiple datasets is one
of the features that is available in dashboards but not supported in reports. Dashboards do not
include the Filter, Visualization, and Fields panes that are available in Power BI Desktop when
working with dashboards. Dashboards, unlike reports, contain only a single page.

, Power BI dashboard creation correct answers The Power BI service provides support for creating
Power BI dashboards. The Power BI mobile app can be used to view dashboards, but not to
create them. Power BI Desktop does not provide support for creating Power BI dashboards.
Power Query is a Microsoft Excel tool that is used for importing data, but not for creating
dashboards.

DAX formular list 10 best-selling products correct answers TOPN - The Power BI service
provides support for creating Power BI dashboards. The Power BI mobile app can be used to
view dashboards, but not to create them. Power BI Desktop does not provide support for creating
Power BI dashboards. Power Query is a Microsoft Excel tool that is used for importing data, but
not for creating dashboards.
MAXA - returns the largest value in a column
MAXX - evaluates an expression for each row and returns the largest value
RANKX - returns ranking of a number in a list of numbers for each row of a target table.

Analytics line correct answers Average line, Constant line

Either the X- or Y-axis constant line allows a DAX measure to be used to provide this value for
the visual. The Min line populates the minimum value for a series already present in the visual.
The Max line populates the maximum value for a series already present in the visual. The
Average line populates the average value for a series already present in the visual.

Data type for a continuous axis correct answers Date data types display well on a continuous
(range) axis where report users understand chronological order. Number data types display well
on a continuous (range) axis where report users understand the order between min and max
values. Binary data and text (categorical) data cannot be displayed on a continuous (range) axis.
Date, time, or number are the only data types comparable with a continuous axis.

Report to display the sales data of customers of a similar age will be grouped into cluster correct
answers Creating a scatter visual is the first step of applying the clustering technique that groups
data into clusters. Card, gauge, and treemap visuals do not support clustering.

Visuals - Identify outliers correct answers A scatter visual displays a relationship between values
associated with two axes: one set of numerical data along a horizontal axis and another set of
numerical values along a vertical axis. It is particularly suitable for identifying outliers because it
displays them away from the bulk of data.
A card visual displays a single data point.
A treemap visual displays data as a set of nested rectangles.
A gauge visual displays a circular arc including a single value that measures progress toward a
goal or target.

Visuals - Support conditional formatting functionality correct answers Matrix and table visuals
support conditional formatting. Gauge chart, scatter chart, and treemap do not support
conditional formatting.

The benefits of buying summaries with Stuvia:

Guaranteed quality through customer reviews

Guaranteed quality through customer reviews

Stuvia customers have reviewed more than 700,000 summaries. This how you know that you are buying the best documents.

Quick and easy check-out

Quick and easy check-out

You can quickly pay through credit card or Stuvia-credit for the summaries. There is no membership needed.

Focus on what matters

Focus on what matters

Your fellow students write the study notes themselves, which is why the documents are always reliable and up-to-date. This ensures you quickly get to the core!

Frequently asked questions

What do I get when I buy this document?

You get a PDF, available immediately after your purchase. The purchased document is accessible anytime, anywhere and indefinitely through your profile.

Satisfaction guarantee: how does it work?

Our satisfaction guarantee ensures that you always find a study document that suits you well. You fill out a form, and our customer service team takes care of the rest.

Who am I buying these notes from?

Stuvia is a marketplace, so you are not buying this document from us, but from seller FullyFocus. Stuvia facilitates payment to the seller.

Will I be stuck with a subscription?

No, you only buy these notes for $11.09. You're not tied to anything after your purchase.

Can Stuvia be trusted?

4.6 stars on Google & Trustpilot (+1000 reviews)

79650 documents were sold in the last 30 days

Founded in 2010, the go-to place to buy study notes for 14 years now

Start selling
$11.09
  • (0)
  Add to cart