Explain the difference between descriptive and inferential statistics.
Identify the types of data and levels of measurement.
Calculate relative and cumulative frequencies frequencies.
Use pivot tables to explore a new data set.
● Exploratory data analysis
○ What kind of data do we have?
○ What do our data look like?
● Predictive analytics
○ What do we expect to happen?
○ What is the relationship between variables?
● Prescriptive analytics
○ What should we do to optimize an outcome?
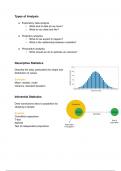
Descriptive Statistics
Describe the data, particularly the shape and
distribution of values.
Examples
Mean, median, mode
Variance, standard deviation
Inferential Statistics
Draw conclusions about a population by
studying a sample.
Example
Correlation,regression
T-test
ANOVA
Test of independent proportions
The benefits of buying summaries with Stuvia:
Guaranteed quality through customer reviews
Stuvia customers have reviewed more than 700,000 summaries. This how you know that you are buying the best documents.
Quick and easy check-out
You can quickly pay through credit card or Stuvia-credit for the summaries. There is no membership needed.
Focus on what matters
Your fellow students write the study notes themselves, which is why the documents are always reliable and up-to-date. This ensures you quickly get to the core!
Frequently asked questions
What do I get when I buy this document?
You get a PDF, available immediately after your purchase. The purchased document is accessible anytime, anywhere and indefinitely through your profile.
Satisfaction guarantee: how does it work?
Our satisfaction guarantee ensures that you always find a study document that suits you well. You fill out a form, and our customer service team takes care of the rest.
Who am I buying these notes from?
Stuvia is a marketplace, so you are not buying this document from us, but from seller alexperez. Stuvia facilitates payment to the seller.
Will I be stuck with a subscription?
No, you only buy these notes for $3.59. You're not tied to anything after your purchase.