Lecture 3 - organizing and presenting data
● Data classification
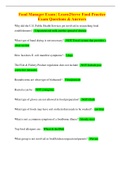
● Frequency histograms
● Relative frequency
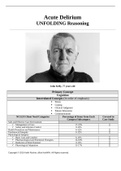
● Cumulative frequency charts
Classifying data general rules:
1. Find the largest and smallest numbers in the data, and thus find the range, which is
the difference between the largest and smallest number.
2. Divide the range into a convenient number of classes. - easier when classes are
equal sizes and usually between 5 to 15 classes
3. Find the number of observations in each class, can be done in tally systems.
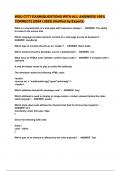
Types of variable:
qualitative (categorical)
Quantitative (measurement) - (then can also be
divided into) discrete and continuous.
Discrete can not have decimal places. - how
many people in a room
Continuous data can have D places. - how long
a phone call is.
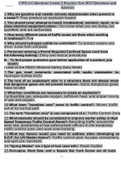
Continuous variable: example. Length of phone calls
What proportion? Relative frequency = frequency / sample size
● Data classification
● Frequency histograms
● Relative frequency
● Cumulative frequency charts
Classifying data general rules:
1. Find the largest and smallest numbers in the data, and thus find the range, which is
the difference between the largest and smallest number.
2. Divide the range into a convenient number of classes. - easier when classes are
equal sizes and usually between 5 to 15 classes
3. Find the number of observations in each class, can be done in tally systems.
Types of variable:
qualitative (categorical)
Quantitative (measurement) - (then can also be
divided into) discrete and continuous.
Discrete can not have decimal places. - how
many people in a room
Continuous data can have D places. - how long
a phone call is.
Continuous variable: example. Length of phone calls
What proportion? Relative frequency = frequency / sample size