lOMoARcPSD|20734855
lOMoARcPSD|20734855
Cardiac
Dysrhythmias
, lOMoARcPSD|20734855
Cardiac Dysrhythmias
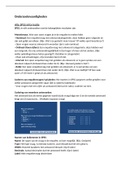
P Waves:
- Represents depolarization of the right and left atria.
P-R Interval on ECG:
- Begins with the onset of the P wave and ends with the onset of the QRS complex.
- Interval is 0.12 to 0.20 seconds.
o Short intervals indicate impulse is originating from somewhere else other
than SA node
o Long intervals may represent a conduction delay through the atria or AV junction
QRS Complex:
- Represents the depolarization of the right and left ventricles
- Q wave is the first negative deflection in the QRS complex
- R wave is the first positive deflection in the QRS complex
- S way is a negative deflection following R wave and it extends below the baseline
Pathological Q Wave:
- 0.04 seconds in width
- Indicate myocardial infarction
ST Segment:
u Represents the early part of repolarization of the ventricles
u Onset begins with the end of QRS complex and ends with the onset of the T wave.
u Duration is 0.20 seconds or less, and is dependent upon the heart rate
u Normal appearance is flat.
u Chance in ST may indicate myocardial damage
u ST segment depression, which is a dip 0.5mm below baseline, may indicate myocardial
ischemia.
u ST segment elevation, 1mm above baseline, indicate myocardial injury.
lOMoARcPSD|20734855
Cardiac
Dysrhythmias
, lOMoARcPSD|20734855
Cardiac Dysrhythmias
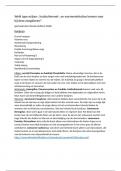
P Waves:
- Represents depolarization of the right and left atria.
P-R Interval on ECG:
- Begins with the onset of the P wave and ends with the onset of the QRS complex.
- Interval is 0.12 to 0.20 seconds.
o Short intervals indicate impulse is originating from somewhere else other
than SA node
o Long intervals may represent a conduction delay through the atria or AV junction
QRS Complex:
- Represents the depolarization of the right and left ventricles
- Q wave is the first negative deflection in the QRS complex
- R wave is the first positive deflection in the QRS complex
- S way is a negative deflection following R wave and it extends below the baseline
Pathological Q Wave:
- 0.04 seconds in width
- Indicate myocardial infarction
ST Segment:
u Represents the early part of repolarization of the ventricles
u Onset begins with the end of QRS complex and ends with the onset of the T wave.
u Duration is 0.20 seconds or less, and is dependent upon the heart rate
u Normal appearance is flat.
u Chance in ST may indicate myocardial damage
u ST segment depression, which is a dip 0.5mm below baseline, may indicate myocardial
ischemia.
u ST segment elevation, 1mm above baseline, indicate myocardial injury.