Please check the examination details below before entering your candidate information Candidate surname Other names Centre Number Candidate Number Pearson Edexcel Level 3 GCE Thursday 25 May 2023 reference 8MA0/22 Afternoon Paper Mathematics Advanced Subsidiary PAPER 22 : Mechanics You must have: Total Marks Mathematical Formulae and Statistical Tables (Green), calculator 2023 Pearson Edexcel Level 3 GCE Mathematics Advanced Subsidiary PAPER 22: Mechanics Question Paper and Mark Scheme Combined Unveiling Excellence!! Candidates may use any calculator allowed by Pearson regulations. Calculators mu st not have the facility for symbolic algebra manipulation, differentiation and integration, or have retrievable mathematical formulae stored in them. Instructions • • Use black ink or ball -point pen. • If pencil is used for diagrams/sketches/graphs it mus t be dark (HB or B). Fill in the boxes at the top of this page with your name, • centre number and candidate number. Answer all questions and ensure that your answers to parts of questions • are clearly labelled. Answer the questions in the spaces provided • – there may be more space than you need . You should show sufficient working to make your methods clear. • Answers without working may not gain full credit. Unless otherwise indicated, wherever a value of g is required, take g = 9.8 m s–
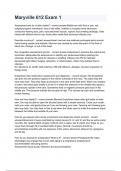
2 and give your a nswer to either 2 significant figures or 3 significant figures. Information • • A booklet 'Mathematical Formulae and Statistical Tables' is provided. • The total mark for this part of the examination is 30. There are 4 questions. The marks for each questio n are shown in brackets – use this as a guide as to how much time to spend on each question . Advice • Read each question carefully before you start to answer it. • Try to answer every question. • Check your answers if you have time at the end. Turn over N:1/1/1/1/ *P74090A0112* P74090A ©2022 Pearson Education Ltd. 1. Velocity (m s–1) 4 (P) X (S) 0 5 27.5 Time (s) Figure 1 Two children, Pat ( P) and Sam ( S), run a race along a straight horizontal track. Both chil dren start from rest at the same time and cross the finish line at the same time. In a model of the motion: Pat accelerates at a constant rate from rest for 5 s until reaching a speed of 4 m s–1 and then maintains a constant speed of 4 m s–1 until crossi ng the finish line. Sam accelerates at a constant rate of 1 m s–2 from rest until reaching a speed of X m s–
1 and then maintains a constant speed of X m s–1 until crossing the finish line. Both children take 27.5 s to complete the race. The velocity -time graphs shown in Figure 1 describe the model of the motion of each child from the instant they start to the instant they cross the finish line together. Using the model, (a) explain why the areas under the two graphs are equal, (1) (b) find the acceler ation of Pat during the first 5 seconds, (1) (c) find, in metres, the length of the race, (2) (d) find the value of X, giving your answer to 3 significant figures. (4) _____________________________________________________________________________________ _____________________________________________________________________________________ _____________________________________________________________________________________ ________________________________________________________________________________ _____ 2 *P74090A0212*