BSc Psychology Year 1
TABLE OF CONTENTS
Descriptive Statistics ............................................................................................ 4
Measures of Central Tendency ....................................................................................... 4
5% trimmed mean .........................................................................................................................4
20% trimmed mean ........................................................................................................................4
Measures of Dispersion (Variability) ................................................................................ 5
Variance and Standard Deviation .................................................................................... 6
Pooled Standard Deviation ..............................................................................................................6
Measurement Data and Categorical Data ......................................................................... 6
Nominal........................................................................................................................................6
Ordinal .........................................................................................................................................7
Interval .........................................................................................................................................7
Ratio ............................................................................................................................................7
Matching the Scales of Measurement .............................................................................. 7
Frequency distributions ................................................................................................. 7
Cumulative Frequency ....................................................................................................................7
Number of Scores ..........................................................................................................................8
Percentages ..................................................................................................................................8
Distribution Scales ....................................................................................................... 8
Example: Mean of 11, Standard Deviation of 5....................................................................................8
Histograms .................................................................................................................. 9
Frequency Scales à Density Scales ............................................................................................... 11
Continuous Curves....................................................................................................................... 11
The Shape of Distributions ........................................................................................... 12
Skewed Distribution ..................................................................................................................... 13
Stem and Leaf Diagrams .............................................................................................. 14
Box Plots (Box-and-whisker diagrams) .......................................................................... 14
Normal Distribution .................................................................................................... 15
The 68-95-99.7 Rule..................................................................................................................... 16
Standardised Scores (z-scores) .................................................................................... 16
Using a z-score to Find a Proportion ................................................................................................ 16
Using a Proportion to Find a z-score ................................................................................................ 17
Use z-scores to identify outliers to be trimmed ................................................................................. 17
Statistical Theory and Statistical Thinking .............................................................. 17
Sampling Variability .................................................................................................... 17
Estimating the Population Mean ..................................................................................................... 17
Estimating a Mean Difference Between Two Groups ......................................................................... 18
Examining Treatment Effects in Experiments ................................................................................... 18
Means are More Variable When… ................................................................................................... 18
Means are Less Variable When… ................................................................................................... 18
Mean Differences are More Variable When… ................................................................................... 18
Mean Differences are Less Variable When… .................................................................................... 18
1
,4PAHPRM1 Research Methods 1 Data Concepts & Data Analysis
BSc Psychology Year 1
The Sampling Distribution of the Mean........................................................................... 18
The Standard Error of the Mean ..................................................................................... 18
The SD of the Sampling Distribution of the Mean............................................................................... 18
The confidence interval for the mean ............................................................................. 19
Analysing Mean Differences ................................................................................. 20
The t-value (t-statistic) ................................................................................................ 20
The t-value is bigger if…................................................................................................................. 20
Statistical Significance .................................................................................................................. 21
Degrees of Freedom .................................................................................................... 21
p-Values (The Associated Probability) ........................................................................... 21
Standardised Effect Size for Mean Differences ............................................................... 22
Describing the Size of Effect (Cohen, 1988) ..................................................................................... 23
Which Standard Deviation to Use ................................................................................................... 23
Type I and Type II Errors ............................................................................................... 23
Probability................................................................................................................................... 23
Probability................................................................................................................................... 24
Direction of mean differences ...................................................................................... 24
Disadvantages of One-Tailed Tests................................................................................................. 24
When Can a One-Tailed Test Be Used? (Kimmel, 1957)..................................................................... 24
The 95% confidence interval of the difference between means ......................................... 25
T-tests: Differences between means ............................................................................. 26
One-Samples t-tests ................................................................................................... 26
Related-Samples (Paired-Samples) t-tests .................................................................... 27
Independent-Samples t-tests....................................................................................... 29
Correlations ....................................................................................................... 29
Direction of Correlations ............................................................................................. 29
Strength of Correlations .............................................................................................. 30
Correlation Coefficients .............................................................................................. 30
Describing the Degree of the Strength of Correlation ......................................................................... 31
Statistical significance ................................................................................................ 32
What Affects the p-value............................................................................................................... 32
Using Correlation Coefficients...................................................................................... 33
Causal Relationship ..................................................................................................................... 33
Reverse Causality ........................................................................................................................ 33
Bidirectional Influence .................................................................................................................. 33
Third-Variable Effect/Common Underlying Cause............................................................................. 34
Coincidence ................................................................................................................................ 34
A correlation matrices ................................................................................................. 34
Partial Correlation ...................................................................................................... 35
Partial Correlation vs Pearson’s r.................................................................................................... 35
2
,4PAHPRM1 Research Methods 1 Data Concepts & Data Analysis
BSc Psychology Year 1
Variance in common: That the two variables are correlated/Scores on the two scales vary with each other
.................................................................................................................................................. 35
Redundant with each other: It is a perfect correlation ........................................................................ 35
Bidimensional: There is an interaction or association between two variables ........................................ 35
Scatter (DOT) Plots ..................................................................................................... 35
Violin Plots ................................................................................................................ 37
Reporting Data ................................................................................................... 37
Example Results Sections ........................................................................................... 37
Identifying Errors ........................................................................................................ 38
Common Errors .......................................................................................................... 38
Equating Non-Significance with No Effect ........................................................................................ 38
Misreporting p-values ................................................................................................................... 38
Misinterpretation of Direction ........................................................................................................ 38
Overreliance on p-values .............................................................................................................. 38
Misstating Degrees of Freedom ...................................................................................................... 39
Ignoring Assumptions of the t-test .................................................................................................. 39
Other SPSS commands........................................................................................ 39
Set up a new variable .................................................................................................. 39
Split a File .................................................................................................................. 39
Computing A new Variable ........................................................................................... 40
Draw random samples ................................................................................................ 41
Filters ....................................................................................................................... 41
3
, 4PAHPRM1 Research Methods 1 Data Concepts & Data Analysis
BSc Psychology Year 1
DESCRIPTIVE STATISTICS
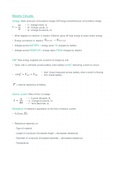
MEASURES OF CENTRAL TENDENCY
Mode
• The score that appears the greatest number of times
Median
• The “middle score” in an ordered list of scores
𝑛+1
𝑀𝑒𝑑𝑖𝑎𝑛 𝐿𝑜𝑐𝑎𝑡𝑖𝑜𝑛 =
2
Mean
• The sum of scores
• The mean of a sample is an unbiased estimator of the mean of the population
∑"
Χ# (𝜇) = # where 𝑋 is the data values, and 𝑁 is the number of scores
Calculating the Measures of Central Tendency
Analyze > Descriptive Statistics > Explore
• Enter relevant variable(s) into the relevant boxes
• Click OK (this will only show the mean and median)
OR
Analyze > Descriptive Statistics > Frequencies...
• Add relevant variables into the Variable(s) box
• Click Statistics and tick Mean, Median and Mode
• Click Continue, then OK
Trimmed Mean
• Calculates the average of a dataset after removing a percentage of the highest and lowest values
• For a 5% trimmed mean, remove the highest 5% and lowest 5% of scores
• For a 20% trimmed mean, remove the highest 20% and lowest 20% of scores
Sample of 40 scores
5% trimmed mean
• 5% of 40 = 2
• Take 2 scores from the top and bottom
20% trimmed mean
• 20% of 40 = 8
• Take 8 scores from the top and bottom
4


