MATH 225N (225N)
Chamberlain College Nursing
Page 2 out of 89 results
Sort by
-
MATH 225N Week 2 Discussion Graphing and Describing Data in Everyday Life (Graded A)
- Other • 4 pages • 2023
-
 ProfFabian007
- $8.99
- + learn more
MATH 225N Week 2 Discussion Graphing and Describing Data in Everyday Life (Graded A)
-
MATH 225 Central Limit Theorem for Proportions Week 5 Assignment : complete solutions (2019/20) Chamberlain.
- Exam (elaborations) • 5 pages • 2022
-
 EXAMITY
- $12.99
- + learn more
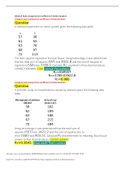
MATH 225 Central Limit Theorem for Proportions Week 5 Assignment: 1. A dental student is conducting a study on the number of people who visit their dentist regularly. Of the 520 people surveyed, 312 indicated that they had visited their dentist within the past year. Find the population proportion, as well as the mean and standard deviation of the sampling distribution for samples of size n=60. 2. From recent census data, it is discovered that the proportion of the adults in the United States who...
-
STATISTIC QUESTIONS AND ANSWERS REVISION FOR YEAR 2022
- Exam (elaborations) • 78 pages • 2022
-
 codersimon
- $10.00
- + learn more
STATISTIC QUESTIONS AND ANSWERS REVISION FOR YEAR 2022
-
MATH 225N Week 8 Assignment Predictions Using Linear Regression (GRADED)
- Exam (elaborations) • 2 pages • 2022
-
 ProfGoodlucK
- $10.99
- + learn more
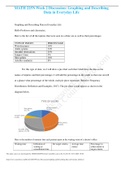
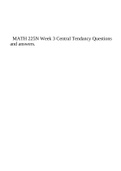
Question: The table shows data collected on the relationship between the time spent studying per day and the time spent reading per day. The line of best fit for the data is yˆ=0.16x+36.2. Assume the line of best fit is significant and there is a strong linear relationship between the variables….. Studying (Minutes) 50,70,90,110 Reading (Minutes) 44,48,50,54…. According to the line of best fit, what would be the predicted number of minutes spent reading for someone who spent 67minutes study...
-
MATH 225N Week 8 Assignment Coefficient of Determination (Download To Score An A)
- Exam (elaborations) • 3 pages • 2022
-
ProfGoodlucK
- $10.99
- + learn more
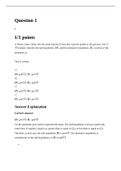
Question: A medical experiment on tumor growth gives the following data table……… The least squares regression line was … Using technology, it was … that the total sum of squares (SST) was 8a nd the sum of squares of regression (SSR) was 3789.0. Calculate R2, rounded to three decimal places. Question: A scientific study on mesothelioma caused by asbestos gives the following data table……. Using technology, it was … that the total sum of squares (SST)was 2 and the sum of squares due...

And that's how you make extra money

-
MATH 225N Week 8 Stats Assignment-Performing Linear Regressions with Technology -Exel . (GRADED)
- Exam (elaborations) • 6 pages • 2022
-
ProfGoodlucK
- $10.99
- + learn more
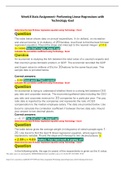
Week 8 Stats Assignment- Performing Linear Regressions with Technology –Exel Determine the best fit linear regression equation using Technology - Excel Question The table below shows data on an nual expenditure, x (in dollars), on recreation and annual income, y (in dollars), of 20 families. Use Excel to find the best fit linear regression equation. Round the slope and intercept to the nearest integer. y=11.0 X+ 14949 Yes that's right. Keep it up! Calculate the correlation coefficient using T...
-
MATH 225N Week 3 Central Tendancy Questions and answers.
- Exam (elaborations) • 27 pages • 2022
-
 LOVELY01
- $10.49
- + learn more
MATH 225N Week 3 Central Tendancy Questions and answers. Week 3 Questions Given the following box-and-whisker plot, decide if the data is skewed or symmetrical. Select the correct answer below: The data are skewed to the left. The data are skewed to the right. The data are symmetric. Which of the following frequency tables show a skewed data set? Select all answers that apply. Select all that apply: Select all that apply: Value Frequency 5 2 6 5 7 9 8 15 9 18 10 24 11 19 12 15...
-
math225n week 8 final very correct
- Exam (elaborations) • 20 pages • 2022
-
 Greatnurse
- $9.49
- 2x sold
- + learn more
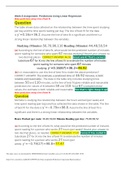
A fitness center claims that the mean amount of time that a person spends at the gym per visit is 33 minutes. Identify the null hypothesis, H0, and the alternative hypothesis, Ha, in terms of the parameter μ. That is correct! H0: μ≠33; Ha: μ=33 H0: μ=33; Ha: μ≠33 H0: μ≥33; Ha: μ<33 H0: μ≤33; Ha: μ>33 Answer Explanation Correct answer: H0: μ=33; Ha: μ≠33
-
Week 2 Quiz Green VERY Correct
- Exam (elaborations) • 17 pages • 2022
-
Greatnurse
- $8.99
- + learn more
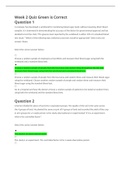
A company has developed a wristband for monitoring blood sugar levels without requiring direct blood samples. It is interested in demonstrating the accuracy of the device for governmental approval and has decided to test the claim "The glucose level reported by the wristband is within 10% of a standard blood test result." Which of the following data collection processes would be appropriate? Select only one answer choice. Select the correct answer below: Choose a random sample of employe...
-
Week 4 Homework Questions Probability
- Exam (elaborations) • 27 pages • 2022
-
Greatnurse
- $8.99
- + learn more
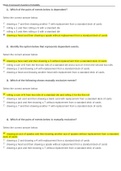
1. Which of the pairs of events below is dependent? Select the correct answer below: drawing a 7 and then drawing another 7 with replacement from a standard deck of cards rolling a 1 and then rolling a 6 with a standard die rolling a 3 and then rolling a 4 with a standard die drawing a heart and then drawing a spade without replacement from a standard deck of cards 2. Identify the option below that represents dependent events. Select the correct answer below
