Heteroskedasticity - Study guides, Class notes & Summaries
Looking for the best study guides, study notes and summaries about Heteroskedasticity? On this page you'll find 59 study documents about Heteroskedasticity.
Page 2 out of 59 results
Sort by

-
Econometrics Exam Review || A+ Verified Solutions.
- Exam (elaborations) • 4 pages • 2024
- $10.49
- + learn more
What happens if an irrelevant x is included in the regression model? correct answers As estimators (betas) are unbiased, the estimate of the coefficient will generally be around 0. This inclusion has an undesirable effect on the variance of the other estimators. What happens if a relevant variable is omitted? correct answers The estimators (betas) will be biased (over or under-estimated). Omitted variable bias! What is the difference between the Breusch-Pagan test and the White-test? cor...

-
ECON0019 (Quantitative Economics and Econometrics) Term 1 Summary - UCL Economics BSc Second Year
- Summary • 166 pages • 2024
- $20.65
- + learn more
Summary of Term 1 taught in ECON0019 (Year 2021/2022) Detailed notes from lecture notes, textbooks and other materials. Topics covered include: 1) Simple Linear Regression (SLR), 2) Multiple Linear Regression (MLR), 3) Finite Sample Inference in MLR, 4) Large-Sample Inference in MLR, 5) MLR with Qualitative Information, 6) Heteroskedasticity, 7) More on Specification and Data Issues, 8) Pooled Regressions and Panel Data Methods I, 9) Panel Data Methods II and 10) MLR: Further Issues.
-
ECON0019 (Quantitative Economics and Econometrics) Term 2 Summary - UCL Economics BSc Second Year
- Summary • 113 pages • 2024
- $20.65
- + learn more
Summary of Term 2 taught in ECON0019 (Year 2021/2022) Detailed notes from lecture notes, textbooks and other materials. Topics covered include: 1) Potential Outcomes and Experiments, 2) Instrumental Variables I, 3) Instrumental Variables II, 4) Simultaneous Equations Models, 5) Limited Dependent Variables I, 6) Limited Dependent Variables II, 7) Limited Dependent Variables III, 8) Limited Dependent Variables IV and Regression with Time Series I, 9) Regression with Time Series III and 10) S...
-
Instructor’s Manual For Principles of Econometrics, Fourth Edition
- Exam (elaborations) • 620 pages • 2024
- $14.99
- + learn more
Solutions to Exercises in: Probability Primer 1 Chapter 2 The Simple Linear Regression Model 21 Chapter 3 Interval Estimation and Hypothesis Testing 54 Chapter 4 Prediction, Goodness of Fit and Modeling Issues 97 Chapter 5 The Multiple Regression Model 132 Chapter 6 Further Inference in the Multiple Regression Model 178 Chapter 7 Using Indicator Variables 225 Chapter 8 Heteroskedasticity 271 Chapter 9 Regression with Time Series Data: Stationary Variables 308 Chapter 10 Random Regresso...
-
ISyE 6402 Midterm Prep With Complete Solutions 2022/2023
- Exam (elaborations) • 7 pages • 2022
- $13.99
- 5x sold
- + learn more
Getting a 3 variable VAR model from summary(model) output of a VAR(1) model first matrix: first row are coefficients for Xt1, second row are coefficients for Xt2, etc... second matrix is Xt-1, i b/c this is a VAR(1) model last matrix are the constants eta_t is covariance matrix, direct copy (c) Based on the fitted model, is there contemporaneous cross-correlation? Is there lagged cross-correlation? Is there lagged auto-correlation? Explain. contemporaneous cross-correlation is ...

Want to regain your expenses?

-
Econometrics Final || Questions and 100% Verified Answers.
- Exam (elaborations) • 8 pages • 2024
- $11.09
- + learn more
Using the notation of the text, letting β0 = 3.0 and β1=2.0 in a regression model implies that: correct answers Y is expected to increase by 2.0 units if X increases by 1 unit If R^2 = 0.8, then correct answers SSR/TSS = 0.2 In a linear regression the one regressor, the standard error of the regression (SER) is defined as correct answers sqrt(SSR/(n-2)) In the simple linear regression model, the regression slope correct answers indicates by how many units Y increases, given a one unit...
-
Applied Econometrics || with 100% Errorless Answers.
- Exam (elaborations) • 6 pages • 2024
- $10.69
- + learn more
panel data (longitudinal data) correct answers data for multiple entities in which each entity is observed at two or more time periods cross-sectional data correct answers Cross sectional data means that we have data from many units, at one point in time. time series data correct answers Time series data means that we have data from one unit, over many points in time. instrumental variable correct answers An instrumental variable (sometimes called an "instrument" variable) is a third ...
-
Economics 1123 Midterm Exam | GRADED A
- Exam (elaborations) • 10 pages • 2024
- $13.49
- + learn more
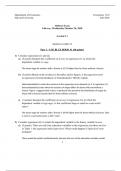
Department of Economics Economics 1123 Harvard University Fall 2020 Midterm Exam 9:00 a.m., Wednesday October 24, 2018 PACKET 2 Solutions in Calibri 11 Part 1 – USE BLUE BOOK #1 (60 points) 1) Consider regressions (1) and (2). a) (5 points) Interpret the coefficient on license in regression (1), in which the dependent variable is wage. The mean wage for workers with a license is $2.76 higher than for those without a license. b) (5 points) Based on the evidence in the ...

-
Department of Economics Economics 1123 Harvard University Fall 2020 Midterm Exam 9:00 a.m., Wednesday October 24, 2018 PACKET 2 Solutions in Calibri 11 Part 1 – USE BLUE BOOK #1 (60 points)
- Exam (elaborations) • 10 pages • 2024
- $13.49
- + learn more
Department of Economics Economics 1123 Harvard University Fall 2020 Midterm Exam 9:00 a.m., Wednesday October 24, 2018 PACKET 2 Solutions in Calibri 11 Part 1 – USE BLUE BOOK #1 (60 points) 1) Consider regressions (1) and (2). a) (5 points) Interpret the coefficient on license in regression (1), in which the dependent variable is wage. The mean wage for workers with a license is $2.76 higher than for those without a license. b) (5 points) Based on the evidence in the ...
-
HBX Core Final Exam Questions & Answers Solved 100% Correct!!
- Exam (elaborations) • 7 pages • 2024
- $7.99
- + learn more
Accounts Payable Turnover - Credit Purchases/Average Accounts Payable Balance. Accumulated Depreciation - A contra-asset. Adjusted R-squared - Adjusted R-Squared is equal to R-squared multiplied by an adjustment factor that decreases slightly as each independent variable is added to a regression model. Use to compare two regression models that have a different number of independent variables. Asset Turnover - Revenue/Average Assets Asset/Expense Accounts - Asset and expense accounts increa...
